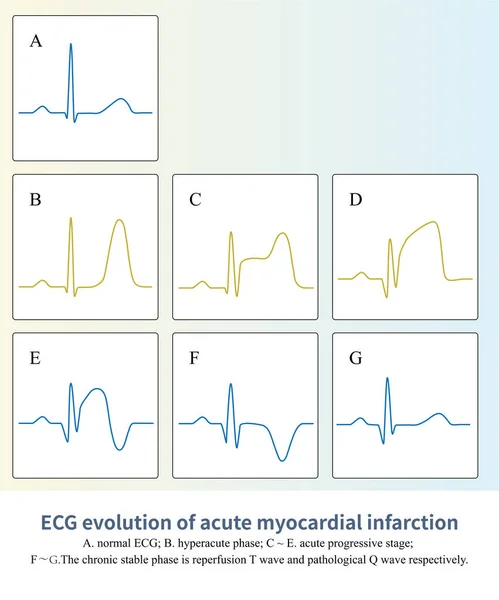
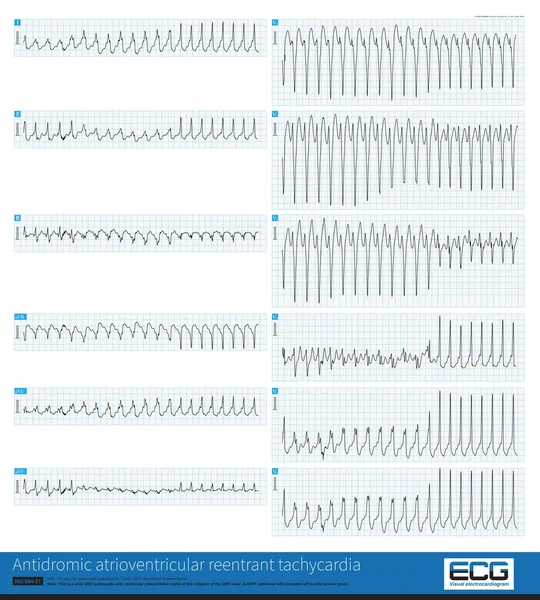
Stock image Sometimes, evolution is found on the ECG of a patient with acute myocardial infarction, depending on the time point or lead of the ST-segment elevation.

Published: Dec.01, 2022 13:08:32
Author: asia11m
Views: 5
Downloads: 0
File type: image / jpg
File size: 8.92 MB
Orginal size: 10000 x 8921 px
Available sizes:
Level: beginner