
Stock image Ecg Education
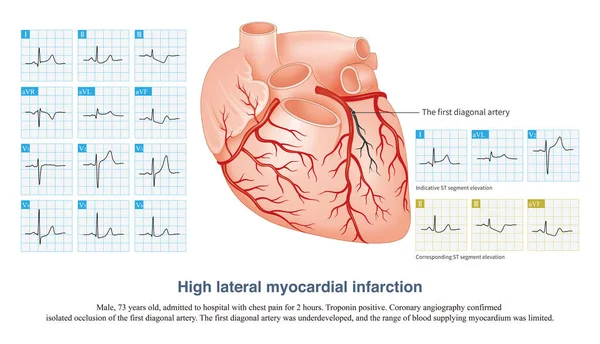
In Acute High Lateral Myocardial Infarction, There Is Indicative ST Segment Elevation In Leads I And AVL, And Corresponding ST Segment Depression In Leads II, III And AVF.
Image, 12.63MB, 10000 × 5739 jpg

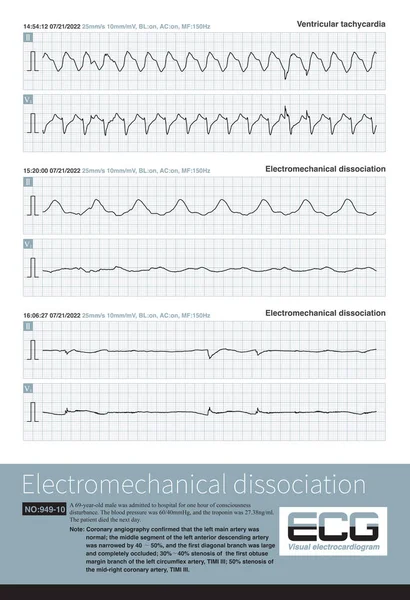
Electromechanical Separation Is A Kind Of Terminal ECG. The Patient's ECG Has Electrical Signals, The ECG Wave Is Widened With Morphological Abnormalities, And The Ventricle Has No Contraction.
Image, 21.68MB, 10000 × 10515 jpg
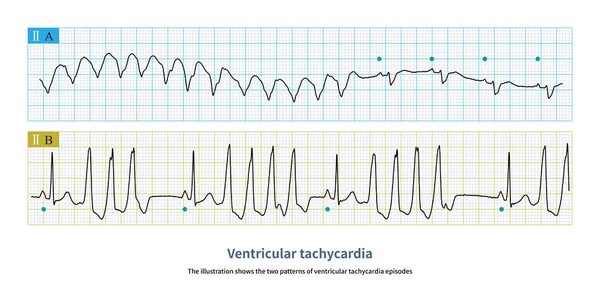
The Illustration Shows The Two Patterns Of Ventricular Tachycardia Episodes.The Green Circle Represents Sinus Rhythm. Picture A Shows Paroxysmal Episodes Of Ventricular Tachycardia, And Picture B Shows Short Bursts.
Image, 10.72MB, 10000 × 5059 jpg
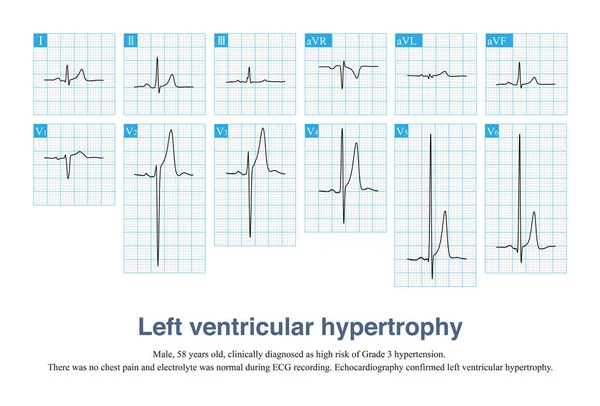
Sometimes, Left Ventricular Hypertrophy With Tall T Waves Is Easily Misdiagnosed As Hyperkalemia And Hyperacute T Waves, And ECG Needs To Be Carefully Identified In Combination With Clinic.
Image, 13.77MB, 10000 × 6782 jpg

Bidirectional Ventricular Tachycardia Is A Kind Of Malignant Arrhythmia. The Polarity Of QRS Main Wave Alternates From Beat To Beat, And It Is Easy To Degenerate Into Ventricular Fibrillation.
Image, 10.66MB, 10000 × 4450 jpg

A 36 Year Old Man Survived CPR After Sudden Syncope. The Electrocardiogram Was Suggestive Of Brugada Syndrome Type 1. Implantation Of ICD Therapy.
Image, 19.26MB, 9000 × 13286 jpg

During Left Posterior Fascicular Block, The ECG Showed Right Axis Deviation. The QRS Wave In Leads I And AVL Was RS Wave, And The Duration Of QRS Wave Was Less Than 120 Ms.
Image, 30.53MB, 10000 × 11472 jpg

Torsade De Pointes Refers To The Pleomorphic Ventricular Tachycardia That Occurs In The Background Of Long QT Interval, And The Polarity Of QRS Wave Twists Around The Equipotential Line.
Image, 18.28MB, 10000 × 5808 jpg

Schemes Set Of Common Electrocardiogram (ECG) Abnormalities, Including Partial Blocks And Flutter
Vector, 9.68MB, 7750 × 4367 eps

R Wave Greater Than S Wave Is Judged To Be Positive; R Smaller Than S Is Judged To Be Negative; R Equal To S Amplitude Is Judged To Be Equipotential.
Image, 7.5MB, 10000 × 5119 jpg
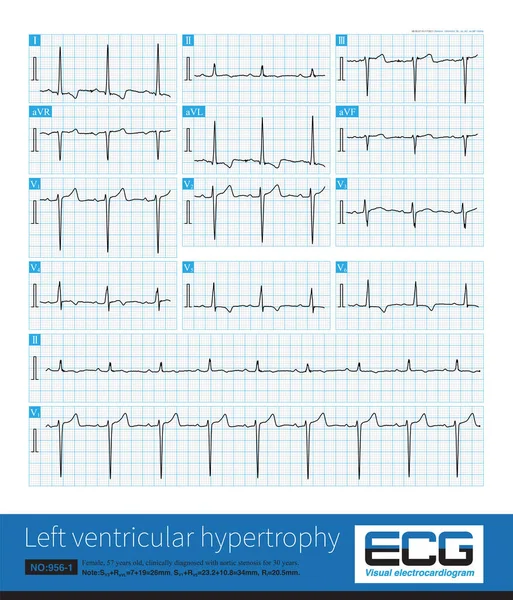
Sometimes, Because The QRS Axis Is In The Upper Left Quadrant, The High-amplitude R Wave Of Left Ventricular Hypertrophy Occurs In The Limb Leads, And Left Chest Leads Is Normal.
Image, 31.4MB, 10000 × 11694 jpg
A Patient With Acute Extensive Anterior Myocardial Infarction Developed Ventricular Tachycardia During Hospitalization And Quickly Experienced Cardiac Arrest.
Image, 31.98MB, 10000 × 14632 jpg
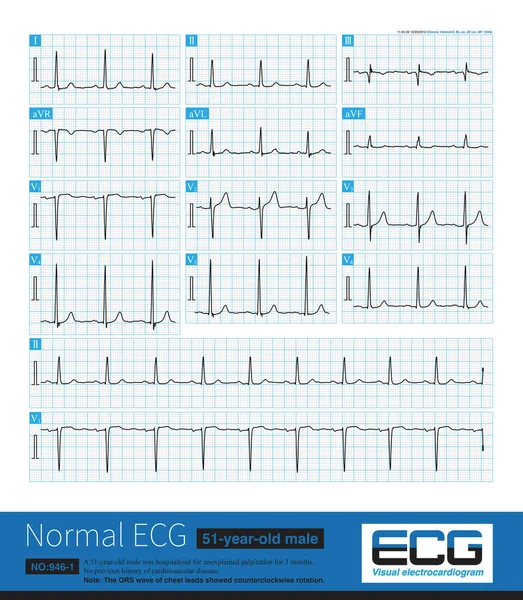
Note That The V3 Lead Of This ECG Shows That The Amplitude Of R Wave Is Greater Than The Amplitude Of S Wave, And There Is Counterclockwise Rotation.
Image, 33.74MB, 10000 × 11469 jpg
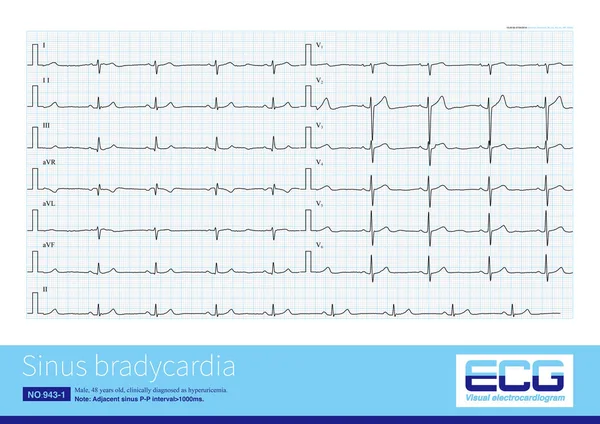
Generally, When The Sinus Heart Rate Is Below 60 Beats Per Minute, It Is Called Sinus Bradycardia. This Arrhythmia Can Be Both Physiological And Often Pathological.
Image, 20.38MB, 10000 × 7069 jpg

Male, 60 Years Old, Clinically Diagnosed As Acute Extensive Anterior Wall Myocardial Infarction. The Patient Died Of Ventricular Fibrillation After Admission.
Image, 10.58MB, 10000 × 6427 jpg

Male, 60 Years Old, Clinically Diagnosed As Acute Extensive Anterior Wall Myocardial Infarction. The Patient Died Of Ventricular Fibrillation After Admission.
Image, 6.05MB, 10000 × 4656 jpg

The QT Interval Of ECG Is From The Beginning Of QRS Wave To The End Of T Wave, Representing The Total Time Of Ventricular Depolarization And Repolarization.
Image, 8.09MB, 10000 × 10950 jpg
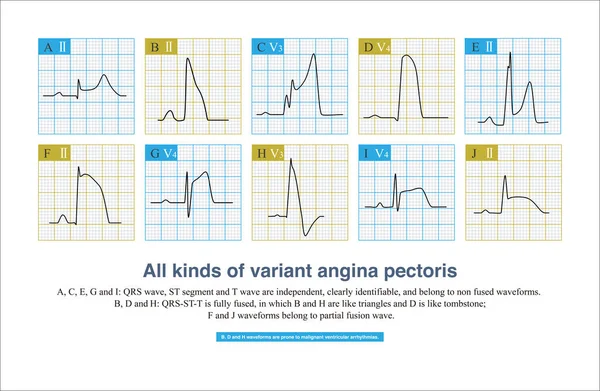
During The Onset Of Variant Angina Pectoris, ECG Is Divided Into Non Fusion Wave, Partial Fusion Wave And Complete Fusion Wave According To The Fusion Degree Of QRS Wave, ST Segment And T Wave.
Image, 7.94MB, 10000 × 6537 jpg
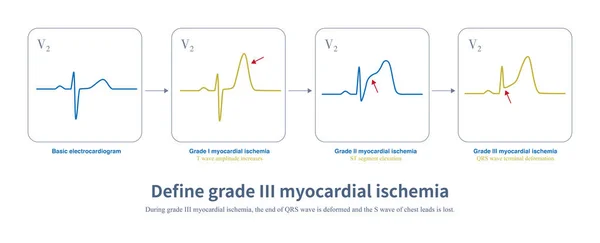
In Acute Myocardial Ischemia, The Amplitude Of T Wave Is Increased First, And Then The ST Segment Is Elevated. When The End Of QRS Wave Is Deformed, There Is A Lack Of Collateral Circulation.
Image, 1.32MB, 10108 × 4093 jpg
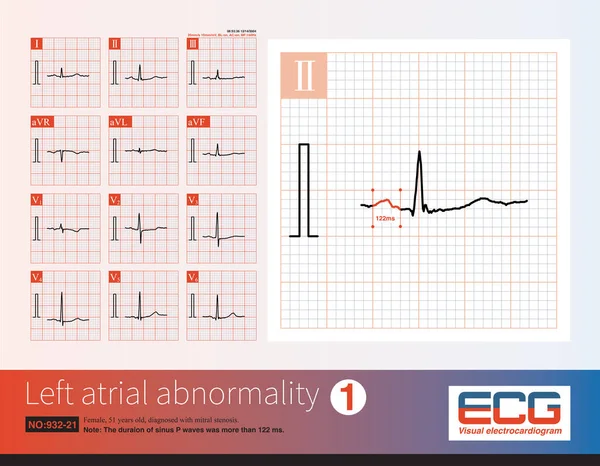
Female, 51 Years Old, Diagnosed With Mitral Stenosis. When This ECG Was Taken, The Patient Still Maintained Sinus Rhythm.Note That The P Wave Duration Was Widened.
Image, 14.21MB, 10000 × 7772 jpg
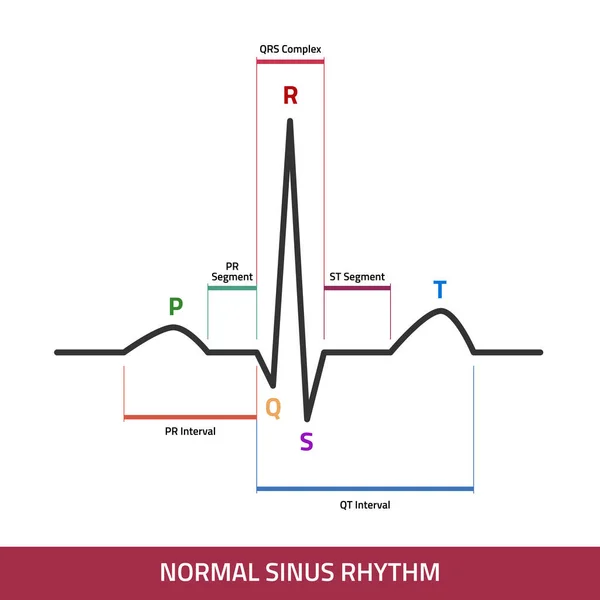
EKG Showing Normal Heartbeat Wave. ECG Of Normal Sinus Rhythm Infographic Diagram.
Vector, 0.61MB, 5000 × 5000 eps

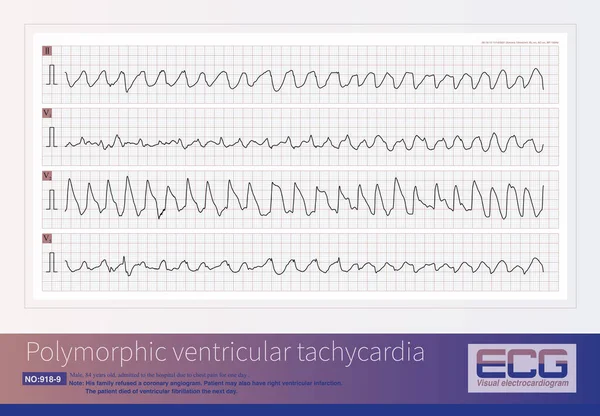
Ventricular Tachyarrhythmia Includes Many Clinical Types, Some Benign And Some Malignant. For Malignant Ventricular Arrhythmias, Patients Are At Risk Of Death.
Image, 27.66MB, 8000 × 10973 jpg
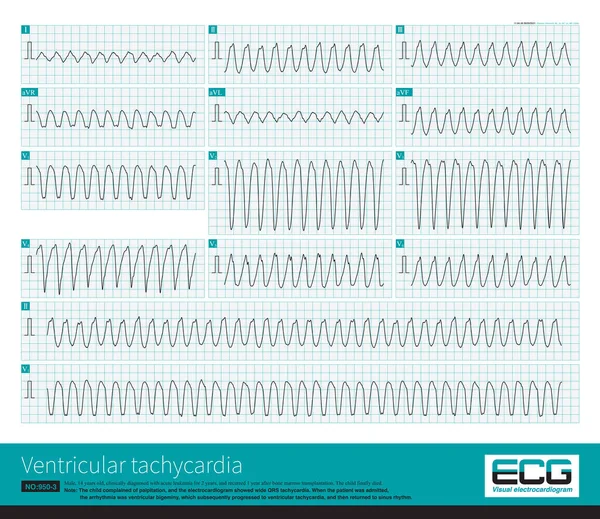
A 14-year-old Leukemic Child Had A Sudden Wide QRS Tachycardia With A Frequency Of 167 Bpm, And The Rhythm Was Regular. After Anti-arrhythmia Treatment, The Patient Recovered To Sinus Rhythm.
Image, 32.12MB, 10000 × 8649 jpg

Atrial Depolarization Forms A P Wave, Ventricular Depolarization Forms A QRS Wave, And Ventricular Repolarization Forms A T Wave, Which Constitutes A Common Waveform Of The Electrocardiogram.
Image, 9.59MB, 10000 × 9917 jpg
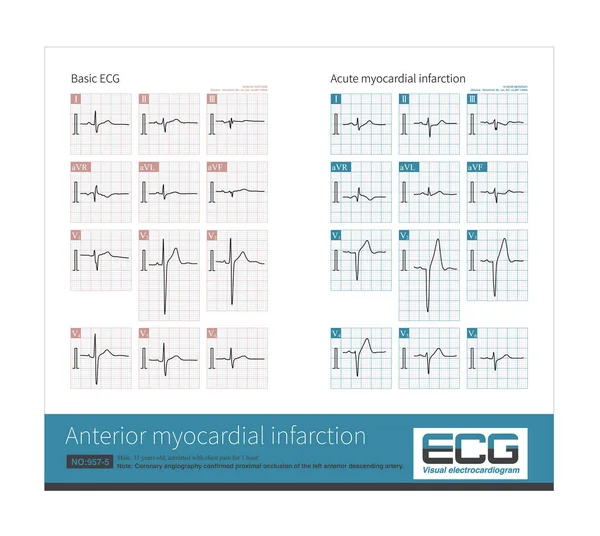
At Present, There Is A Younger Trend In Patients With Acute Myocardial Infarction, So It Is Important To Check The ECG For Acute Chest Pain In Young People.
Image, 15.75MB, 10000 × 8939 jpg
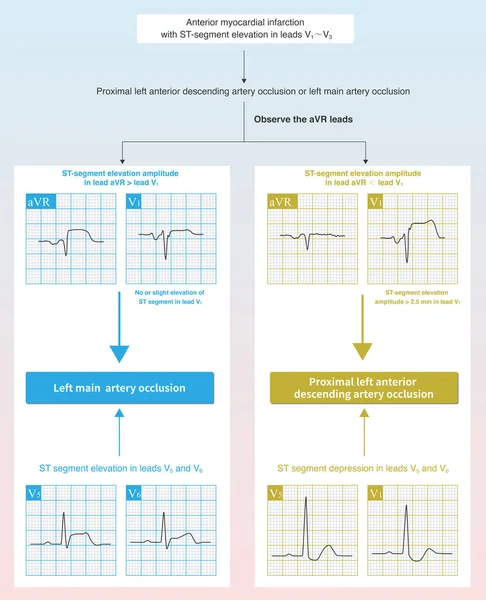
In Case Of Acute Anterior Myocardial Infarction, The Characteristics Of ST Segment Elevation In ECG Can Be Used To Deduce Whether The Culprit Vessel System Is The Left Main Trunk Or The Proximal LAD.
Image, 17.81MB, 10000 × 12321 jpg

Coronary Artery Spasm Causes Transmural Myocardial Ischemia, And ST Segment Elevation In ECG Has Localization Characteristics. Criminal Vessels Can Be Derived From ST Segment Elevation Leads In ECG.
Image, 11.66MB, 10000 × 7684 jpg
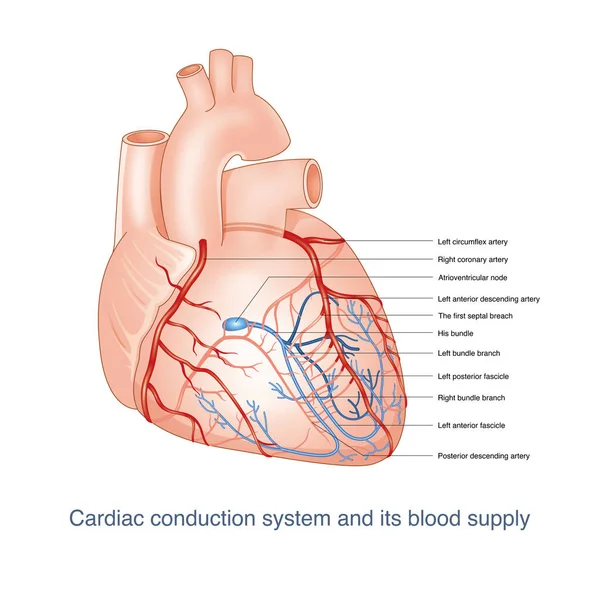
The Conduction System Of The Heart Is Supplied By The Branches Of The Coronary Artery. Once The Blood Vessels Are Blocked, It Can Cause Conduction Disorder. This Picture Is Suitable For Dark Background. This Picture Is Suitable For Light Background.
Image, 12.07MB, 10000 × 10000 jpg

In Complete Left Bundle Branch Block, The Conduction Of The LBB Can Be Completely Interrupted Or Can Still Be Conducted, But It Is Delayed By At Least 45ms Than The RBB.
Image, 10.8MB, 10000 × 5497 jpg
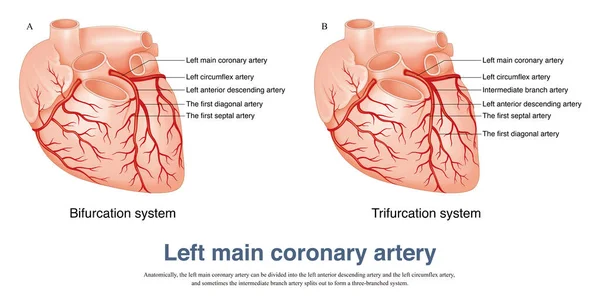
The Left Main Coronary Artery Can Be Divided Into The Left Anterior Descending Artery And The Left Circumflex Artery, And Sometimes The Intermediate Branch Artery.
Image, 7.94MB, 10000 × 5094 jpg
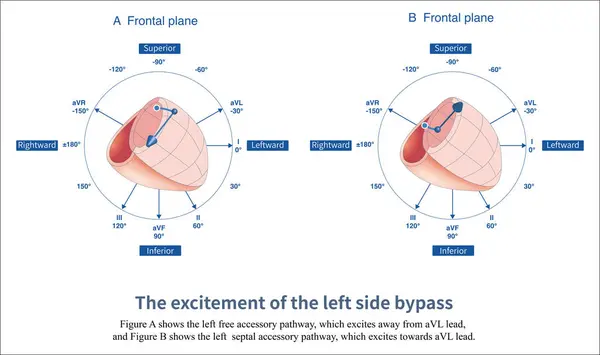
When The Left Free Wall And Septal Accessory Pathway Are Excited, Preexcitation Waves With Different Polarities Are Generated In Leads And AVL.
Image, 6.98MB, 14851 × 8810 jpg
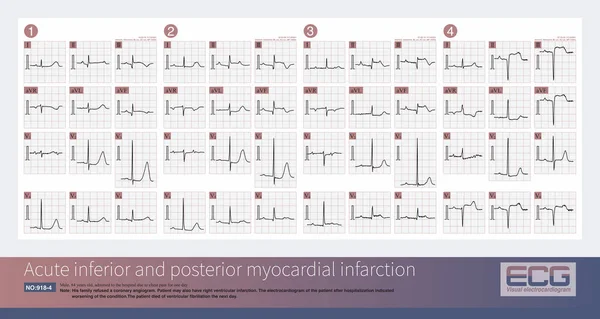
Male, 84 Years Old, Admitted To Hospital With Chest Pain For 1 Day. ECG Showed Acute Inferior And Posterior MI And Possibly Right MI. The Patient Died Of Ventricular Fibrillation The Next Day.
Image, 17.76MB, 10000 × 6934 jpg
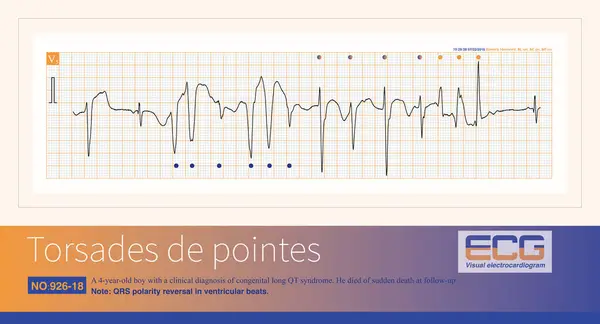
A 4-year-old Boy With A Clinical Diagnosis Of Long QT Syndrome. No Genetic Testing Was Done During Hospitalization. The Child Died Suddenly During Follow-up.
Image, 7.66MB, 10000 × 5414 jpg
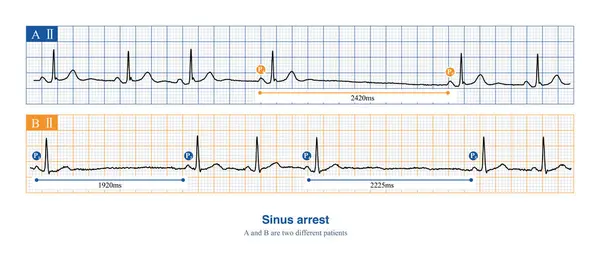
When Sinus Arrest Occurs, The Electrocardiogram Will Show A Long P-P Interval, Which Is Not Multiples Of The Basal Sinus Cycle, Including Physiological And Pathological Reasons.
Image, 8.96MB, 10000 × 4418 jpg

When The Rhythm Of The Atria Originates In The Lower Part Of The Atria, The Whole Atria Are Excited From Inferior To Superior, Producing Negative P Waves In The Inferior Leads.
Image, 11.92MB, 10000 × 8280 jpg
Male, 84 Years Old, Admitted To Hospital With Chest Pain For 1 Day. These ECG Rhythms Are The Holter Monitor Records Of The Patients After Admission, And They Are Third Degree Atrioventricular Block.
Image, 16.1MB, 10000 × 5331 jpg

On The Electrocardiogram, Observing The Morphology Of QRS Waves In Lead V1 Can Distinguish Whether Ventricular Pre Excitation Is Located In The Left Ventricle Or The Right Ventricle.
Image, 4.78MB, 10000 × 11226 jpg
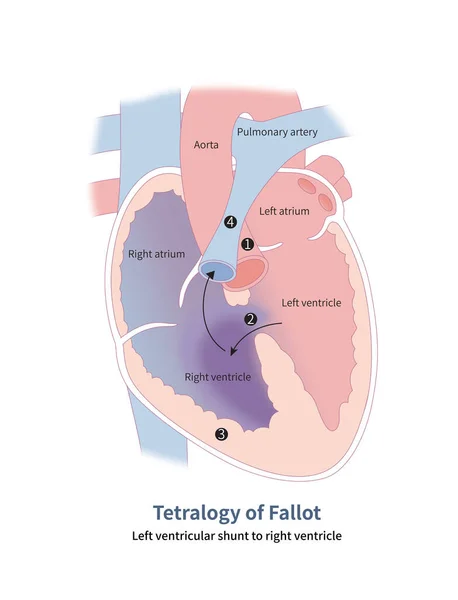
Four Anatomical Malformations Of Tetralogy Of Fallot: 1 Aortic Straddling; 2 Ventricular Septal Defect; 3 Right Ventricular Hypertrophy And 4 Pulmonary Artery Stenosis.
Image, 12.08MB, 10000 × 13070 jpg

When The Ventricular Preexcitation Wave Leaves The Baseline And Then Falls Back To The Baseline, It Is Interpreted As An Isoelectric Line Preexcitation Wave.
Image, 9.3MB, 10000 × 11275 jpg

When The Left Anterior Wall And Posterior Wall Accessory Pathway Are Excited, Preexcitation Waves With Different Polarities Are Generated In The Inferior Wall Leads Of , And AVF.
Image, 3.66MB, 10000 × 5932 jpg

When The Sinus P Wave On The Ecg Disappears, It May Be Due To Abnormal Generation And/or Conduction Of Sinus Impulses, Or It May Be Due To Atrial Muscle Lesions That Cannot Excite.
Image, 3.98MB, 10000 × 2968 jpg
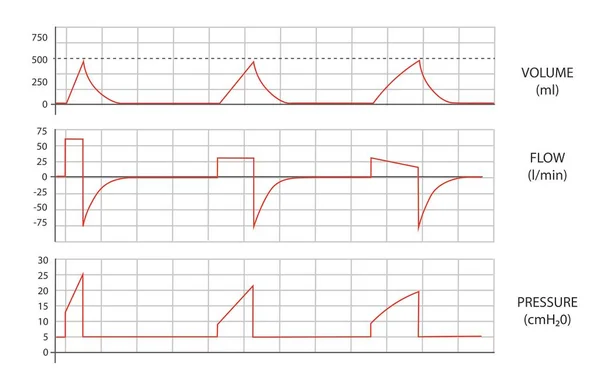
Mechanical Ventilation Waves. Volume, Flow And Pressure Curves From A Mechanical Ventilator.
Image, 2.61MB, 7849 × 4969 jpg

Male, 71 Years Old, Was Clinically Diagnosed With Upper Gastrointestinal Bleeding. During Sleep At Night, ECG Monitoring Showed Sinus Bradycardia, Blood Pressure 115 And 70mmHg.
Image, 5.5MB, 10000 × 3232 jpg

Ventricular Preexcitation Is The Pre Excitation Of A Portion Of The Ventricular Muscle By The Accessory Pathway, Forming A Rough And Dull, And Fuzzy Wave That Can Be Positive, Negative, Or Biphasic.
Image, 7.55MB, 10000 × 11891 jpg

Ventricular Preexcitation Is A Fusion Wave Formed By The Accessory Pathway And Normal Atrioventricular Conduction System Exciting A Part Of Ventricle Respectively.
Image, 4.25MB, 10000 × 10000 jpg

Abnormal ECG Refers To Changes In Depolarization Waves And Or Repolarization Waves, Most Of Which Are Pathologic And Few Are Physiological.
Image, 7.91MB, 10000 × 5625 jpg

When Ventricular Preexcitation Components Occupy Different Proportions Of QRS Waves, The Measured PJ Intervals Are Different.
Image, 4.21MB, 10000 × 4226 jpg

On The Electrocardiogram, Observing The Morphology Of QRS Waves In Lead V1 Can Distinguish Whether Ventricular Pre Excitation Is Located In The Left Ventricle Or The Right Ventricle.
Image, 18.67MB, 10000 × 14900 jpg
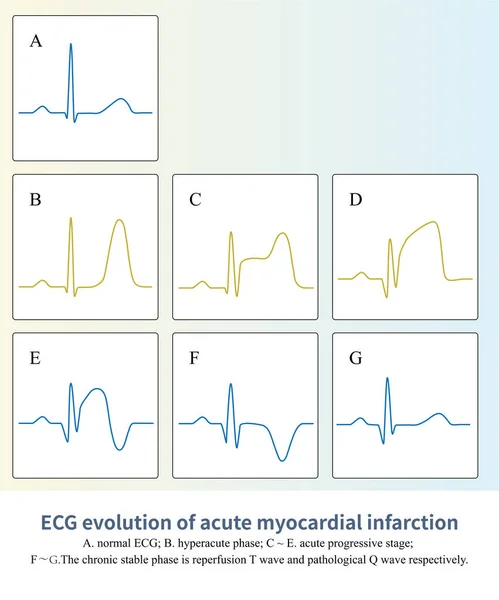
In ST Segment Elevation Myocardial Infarction, The ST-T Of ECG Will Undergo A Characteristic Evolution Process, And Finally Appear Pathological Q Wave, Sometimes Lasting For A Lifetime.
Image, 7.27MB, 8000 × 9619 jpg
Page 1 >> Next