photo free
Home Images Vectors Videos

Stock vector abstract background of Stock Market bollinger bands indicator technical analysis graph
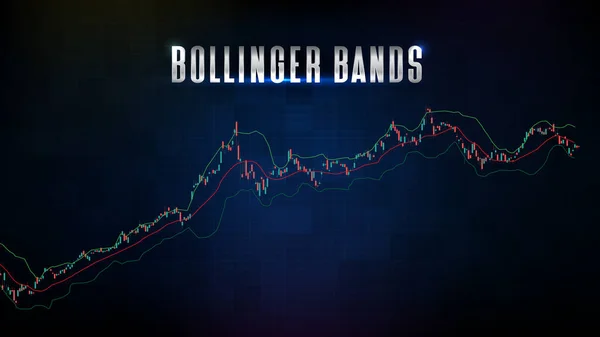
Stock vector abstract background of Stock Market bollinger bands indicator technical analysis graph
Published: May.19, 2021 18:41:58
Author: moxumbic
Views: 11
Downloads: 5
File type: vector / eps
File size: 9.01 MB
Orginal size: 6000 x 3375 px
Available sizes:
S
(500 x 281)
M
(1000 x 563)
L
(2000 x 1125)
XL
(6000 x 3375)
VECT
(6000 x 3375)
EL0
(6000 x 3375)
Level: bronze
Download Vector
Vector topics:

Similar stock vectors

stock vector abstract background of stock market Bollinger Bands Trading Strategy and candle stick graph

Abstract Background Of Stock Market Bollinger Bands Trading Strategy And Candle Stick Graph

6000 × 3375
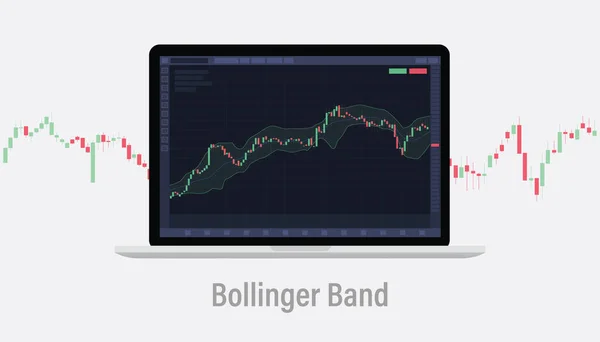
stock vector bollinger band technical analysis indicator concept on laptop screen with candlestick with modern flat style vector illustration

Bollinger Band Technical Analysis Indicator Concept On Laptop Screen With Candlestick With Modern Flat Style Vector Illustration

7000 × 4000
stock vector Bollinger Bands indicator for stock market analysis. Strategies for trading and investment. Forex and cryptocurrency exchange market. Vector illustration concept

Bollinger Bands Indicator For Stock Market Analysis. Strategies For Trading And Investment. Forex And Cryptocurrency Exchange Market. Vector Illustration Concept

5000 × 3500
stock vector Bollinger Bands technical analysis indicator cloud on stock market, forex and cryptocurrency trading exchange market. Laptop display screen with graph and candle stick

Bollinger Bands Technical Analysis Indicator Cloud On Stock Market, Forex And Cryptocurrency Trading Exchange Market. Laptop Display Screen With Graph And Candle Stick

5000 × 3214
stock vector bollinger band indicator for stock market trading with candle stick and modern flat style vector illustration

Bollinger Band Indicator For Stock Market Trading With Candle Stick And Modern Flat Style Vector Illustration

7000 × 4000
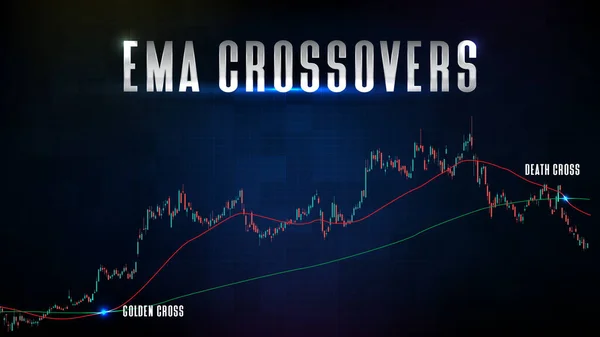
stock vector abstract background of Stock Market and EMA ema crossover golden cross and death cross indicator technical analysis graph

Abstract Background Of Stock Market And EMA Ema Crossover Golden Cross And Death Cross Indicator Technical Analysis Graph

6000 × 3375
stock vector abstract futuristic technology background of Bull and bear stock market and candle stick bar chart graph green and red

Abstract Futuristic Technology Background Of Bull And Bear Stock Market And Candle Stick Bar Chart Graph Green And Red

6000 × 3375
stock vector abstract futuristic technology background of gold commodity and market graph volume indicator

Abstract Futuristic Technology Background Of Gold Commodity And Market Graph Volume Indicator

6000 × 3375