Home
Images
Vectors
Videos
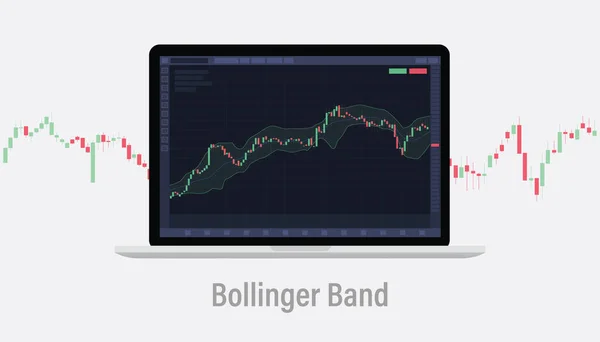
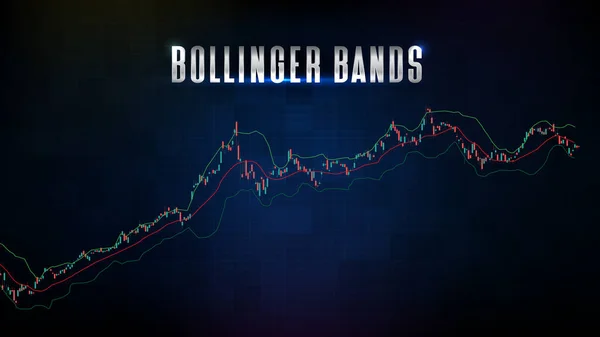
Stock vector Bollinger Bands indicator for stock market analysis. Strategies for trading and investment. Forex and cryptocurrency exchange market. Vector illustration concept
Published:
Jun.13, 2023 04:14:19
Author:
bestforbest
Views:
2
Downloads:
0
File type:
vector
/
eps
File size:
5.97 MB
Orginal size:
5000
x
3500
px
Available sizes:
S
(500 x 350)
M
(1000 x 700)
L
(2000 x 1400)
XL
(5000 x 3500)
VECT
(5000 x 3500)
EL0
(5000 x 3500)
Level:
bronze
Download Vector
Vector topics:
Green
Money
Illustration
Business
Financial
Market
Trading
Success
Growth
Cloud
Technology
Modern
Price
Candle
Bear
Digital
Data
Currency
Exchange
Investment
Finance
Invest
Stock
Long
Volume
Stick
Order
Technical
Short
Bull
Loss
Analysis
Value
Chart
Signal
Trade
Statistics
Profit
Indicator
Bands
Statistic
Trend
Forex
Trader
Oscillator
Bullish
Crypto
Bollinger
Cryptocurrency
Bollinger Bands
Similar stock vectors
Bollinger Band Technical Analysis Indicator Concept On Laptop Screen With Candlestick With Modern Flat Style Vector Illustration
7000 × 4000
Abstract Background Of Stock Market Bollinger Bands Indicator Technical Analysis Graph
6000 × 3375
Bollinger Bands Technical Analysis Indicator Cloud On Stock Market, Forex And Cryptocurrency Trading Exchange Market. Laptop Display Screen With Graph And Candle Stick
5000 × 3214
Inverted Cup And Handle Pattern - Bearish Technical Analysis Continuation Trend Chart Figure. Stock, Cryptocurrency, Forex, Trading Market Price Breakout Vector Illustration With Black Background.
5000 × 3600
The Particles, Geometric Art, Line And Dot Of Flag
9376 × 6251
Cup And Handle Pattern - Bullish Technical Analysis Continuation Trend Chart Figure. Stock, Cryptocurrency Graph, Forex Analytics, Trading Market Price Breakout Vector Illustration, Black Background.
5000 × 3600
Financial Candlestick Chart.
5556 × 3334
Forex Market Vector Icon Illustration
5000 × 4000