Home
Images
Vectors
Videos
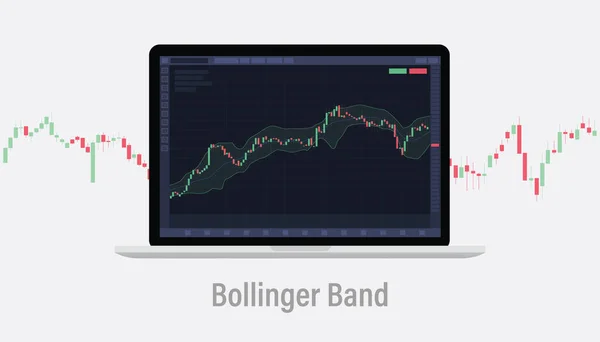
Stock vector bollinger band technical analysis indicator concept on laptop screen with candlestick with modern flat style vector illustration
Published:
Nov.25, 2022 07:39:03
Author:
ribkhan
Views:
5
Downloads:
1
File type:
vector
/
eps
File size:
1.11 MB
Orginal size:
7000
x
4000
px
Available sizes:
S
(500 x 286)
M
(1000 x 571)
L
(2000 x 1143)
XL
(7000 x 4000)
VECT
(7000 x 4000)
EL0
(7000 x 4000)
Level:
bronze
Download Vector
Vector topics:
Money
Illustration
Sale
Business
Buy
Financial
Market
Rate
Growth
Technology
Modern
Band
Text
Candle
Display
Screen
Digital
Support
Laptop
Data
Currency
Exchange
Investment
Finance
Stock
Strategy
Name
Volume
Stick
Technical
Analysis
Graph
Chart
Sell
Economic
Word
Candlestick
Entry
Trade
Profit
Indicator
Diagram
Bands
Average
Statistic
Forex
Oscillator
Candlesticks
Bollinger
Bollinger Bands
Similar stock vectors
Bollinger Band Indicator Stock Market Trading Exchange Infographic Concept For Slide Presentation With 4 Point List Vector Illustration
5760 × 3240
Bollinger Bands Indicator For Stock Market Analysis. Strategies For Trading And Investment. Forex And Cryptocurrency Exchange Market. Vector Illustration Concept
5000 × 3500
Bollinger Bands Technical Analysis Indicator Cloud On Stock Market, Forex And Cryptocurrency Trading Exchange Market. Laptop Display Screen With Graph And Candle Stick
5000 × 3214
Bollinger Band Indicator For Stock Market Trading With Candle Stick And Modern Flat Style Vector Illustration
7000 × 4000
Abstract Background Of Stock Market Bollinger Bands Indicator Technical Analysis Graph
6000 × 3375
A Collection Of Infographic Elements On The Topic Of Trading On The Stock Exchange. You Can Make UI Design Or Quickly Create A Decorative Design For Your Projects.
5000 × 3000
Stock Market And Exchange. Forex Trading Pattern.
4437 × 6761
Cryptocurrencies Trading, And Exchange UI Or UX Concept For Mobile Apps.
6901 × 6901