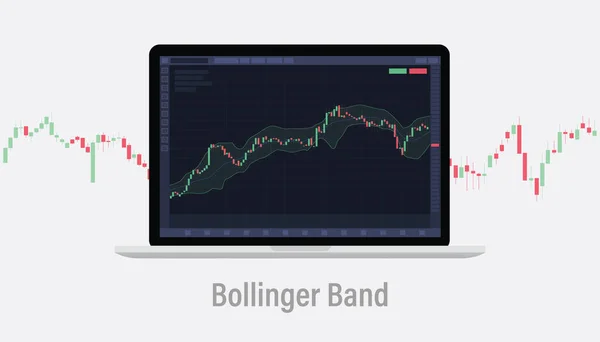
Stock vector bollinger band indicator stock market trading exchange infographic concept for slide presentation with 4 point list vector illustration

Published: Nov.27, 2022 07:30:49
Author: ribkhan
Views: 2
Downloads: 0
File type: vector / eps
File size: 1.95 MB
Orginal size: 5760 x 3240 px
Available sizes:
Level: bronze