
Stock image Dominant Gene
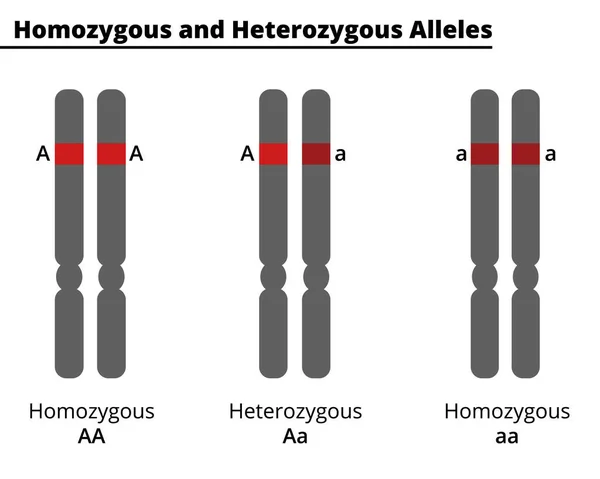
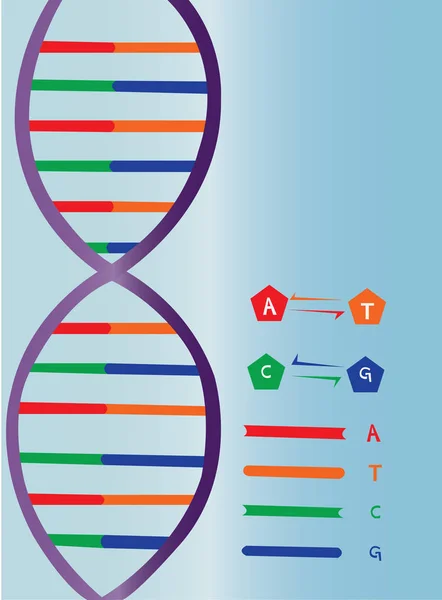
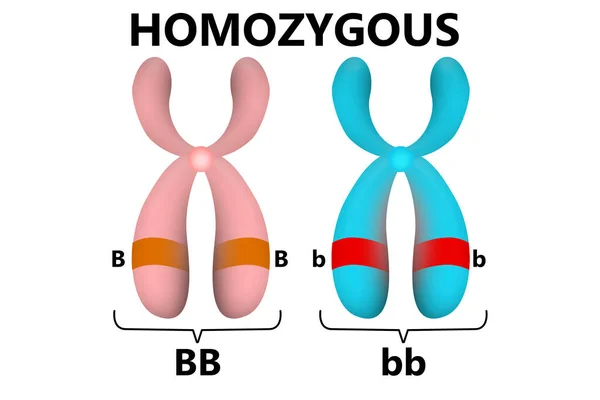
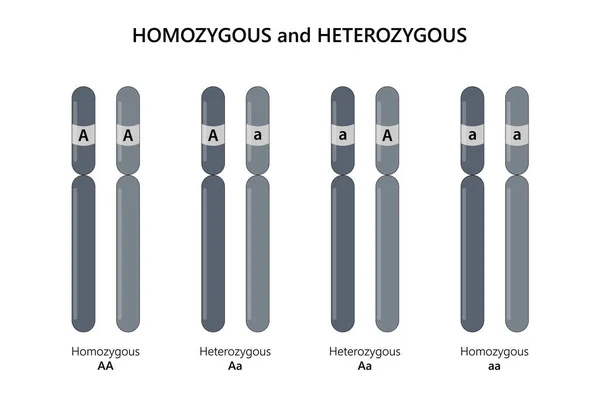
Difference Between Homozygous And Heterozygous Alleles. Genotype Of A Diploid Organism On A Single DNA Site. Vector Illustration. Didatic Illustration.
Vector, 0.56MB, 5000 × 4000 ai
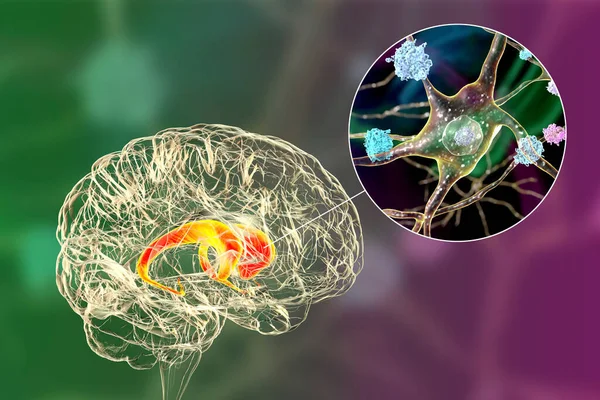
Neuronal Inclusions In The Caudate Nucleus Of The Brain In Huntington's Disease, 3D Illustration. Inclusions Are Composed Of Mutated Huntingtin Protein, They Are Found In Nuclei, Axons And Dendrites
Image, 13.03MB, 7996 × 5331 jpg
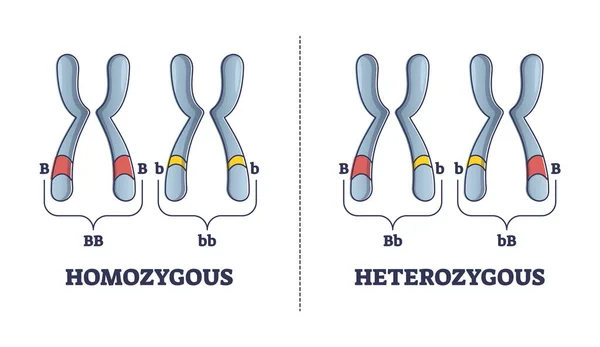
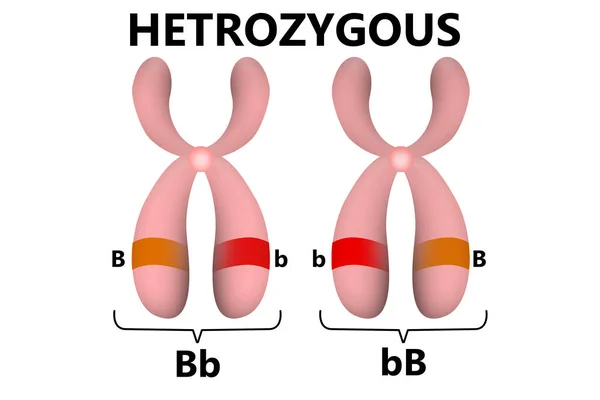
Heterozygous Vs Homozygous Parent Gene Differences Comparison Outline Diagram
Vector, 5.7MB, 5500 × 3184 eps
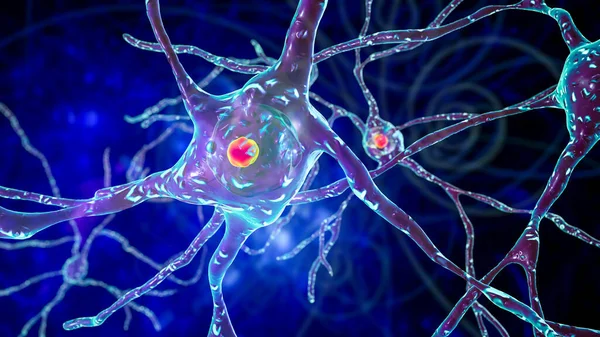
Intranuclear Neuronal Inclusions, 3D Illustration. Intranuclear Inclusions In Neurons Are Found In Different Neurodegenerative Diseases, Including Huntingon's Disease, Spinocerebellar Ataxia And Other
Image, 8.23MB, 7200 × 4050 jpg
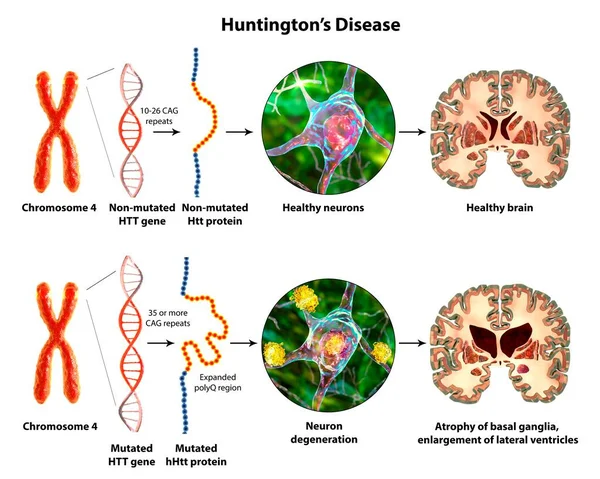
Molecular Genesis Of Huntington's Disease, 3D Illustration. Expansion Of The CAG Trinucleotide Sequence In The Htt Gene Causes Production Of Mutated Huntingtin Protein Leading To Neurodegeneration
Image, 17.01MB, 12941 × 10352 jpg

Neuronal Inclusions In Huntington's Disease, 3D Illustration. Inclusions Are Composed Of Mutated Huntingtin Protein, They Are Initially Formed At Axons And Dendrites, Then Migrate To Nuclei Of Neurons
Image, 9.3MB, 7200 × 4050 jpg

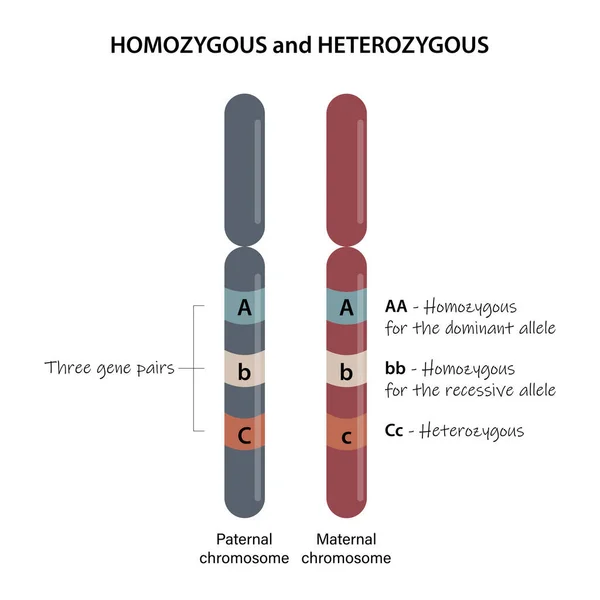
Homozygous And Heterozygous. A Comparison Of Homologous Chromosomes.
Image, 2.75MB, 10417 × 10417 jpg

Intranuclear Neuronal Inclusions, 3D Illustration. Intranuclear Inclusions In Neurons Are Found In Different Neurodegenerative Diseases, Including Huntingon's Disease, Spinocerebellar Ataxia And Other
Image, 9.43MB, 7200 × 4050 jpg
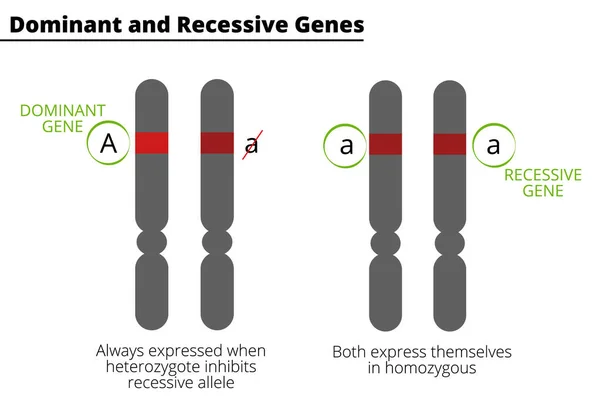
Difference Between Dominant And Recessive Genes. Homozygous And Heterozygous. Genotype. Vector Illustration. Didactic Illustration.
Vector, 0.58MB, 5000 × 3500 ai

Dorsal Striatum, Caudate Nucleus And Putamen, Highlighted In The Brain Of A Person With Huntington's Disease And Close-up View Of Neuronal Inclusions, Conceptual 3D Illustration
Image, 7.98MB, 6000 × 6000 jpg
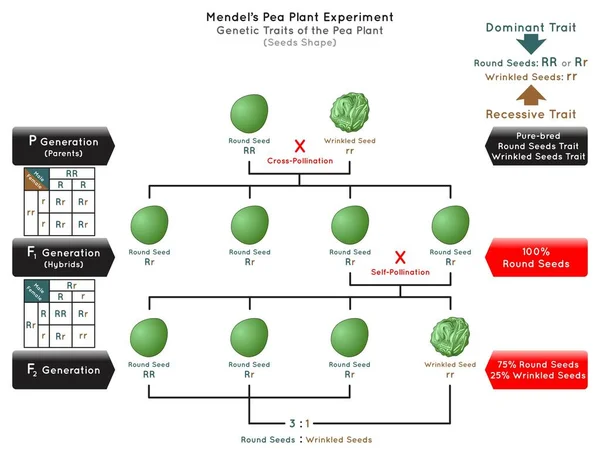
Seeds Shape Genetic Trait Pea Plant Mendel Experiment Infographic Diagram Cross Pollination Pure Bred Parent Generation Hybrid Dominant Round Recessive Wrinkled Biology Science Education Vector
Vector, 1.38MB, 2850 × 2166 eps

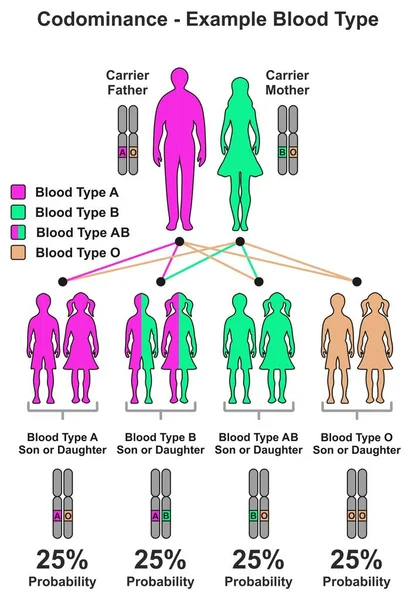
Codominance Example Blood Type Infographic Diagram Including Parents Carrier Father And Mother Probability Of Son And Daughter To Be Have Different Combinations Of Dominant Recessive Genes
Vector, 0.49MB, 1684 × 2451 eps

Dorsal Striatum, Caudate Nucleus And Putamen, Highlighted In The Brain Of A Person With Huntington's Disease And Close-up View Of Neuronal Degradation, Conceptual 3D Illustration
Image, 12.32MB, 7814 × 5210 jpg
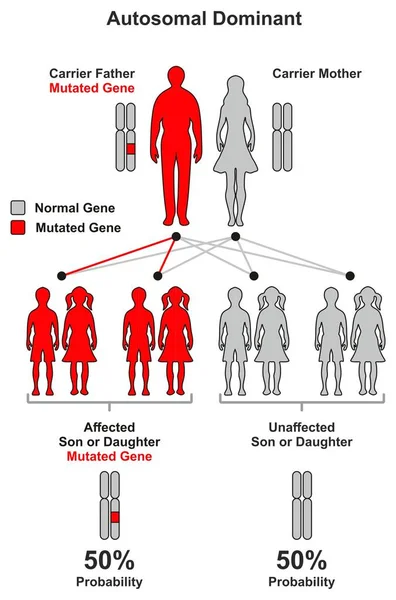
Autosomal Dominant Hereditary Trait Infographic Diagram Including Parents Father And Mother Probability Of Son And Daughter To Be Affected Or Unaffected By Mutated Gene For Genetic Science Education
Vector, 0.38MB, 1650 × 2499 eps
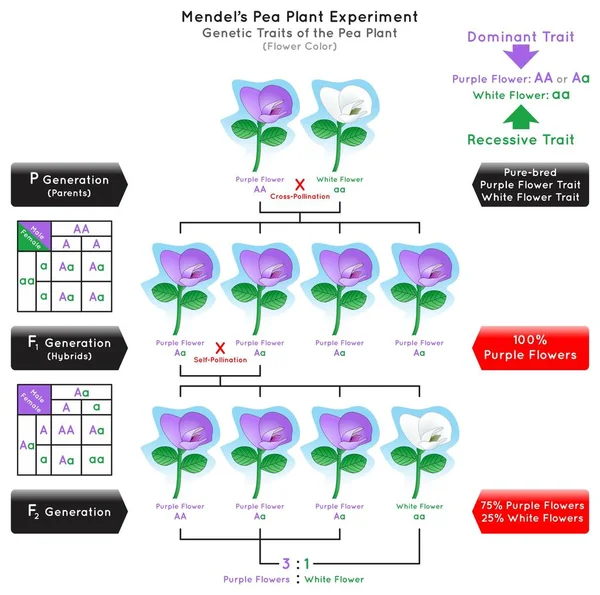
Flower Color Genetic Trait Pea Plant Mendel Experiment Infographic Diagram Cross Pollination Pure Bred Parent Generation Hybrid Dominant Purple Recessive White Biology Science Education Vector
Vector, 1.98MB, 2476 × 2460 eps
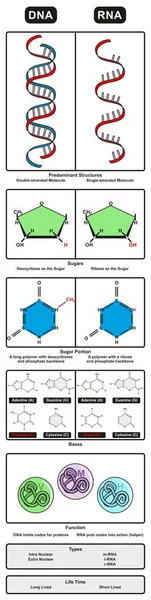
DNA Vs RNA Infographic Diagram A Comparison Including Predominant Structure Sugar Portion Bases Function Types And Life Time For Medical Science Education And Health Care
Vector, 0.7MB, 1036 × 4105 eps

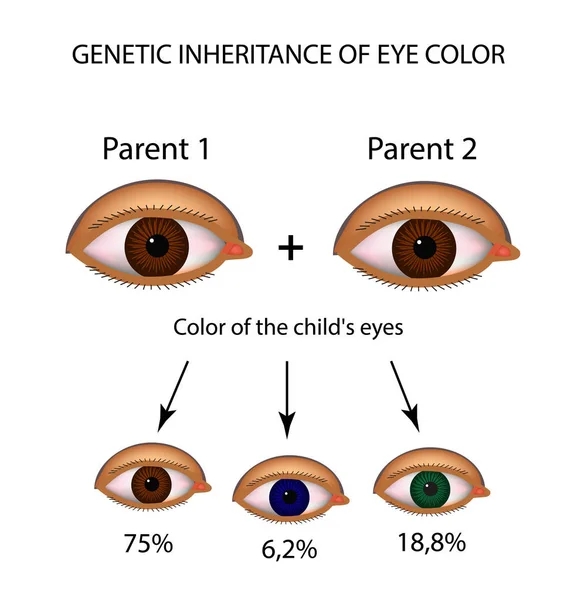
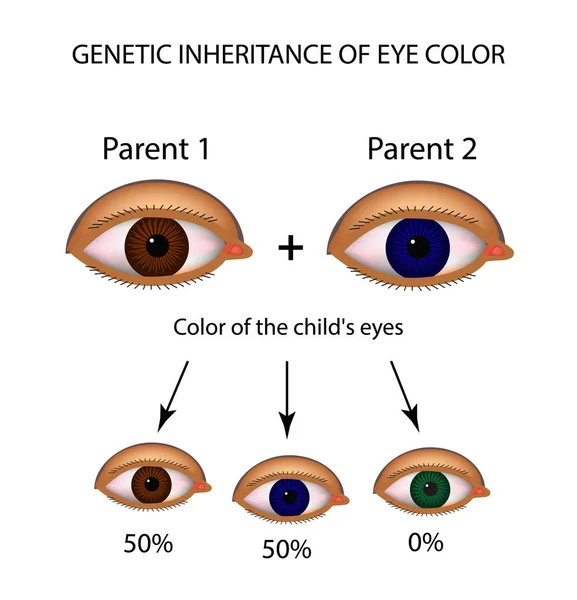
Genetic Inheritance Of Eye Color. Brown, Blue, Green Eyes. Infographics. Vector Illustration On Isolated Background
Vector, 1.27MB, 5000 × 5200 eps
Genetic Inheritance Of Eye Color. Brown, Blue, Green Eyes. Infographics. Vector Illustration On Isolated Background
Vector, 1.27MB, 5000 × 5200 eps
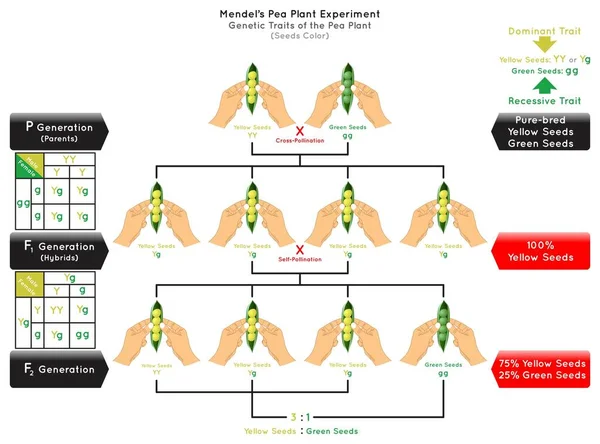
Seeds Color Genetic Trait Pea Plant Mendel Experiment Infographic Diagram Cross Pollination Pure Bred Parent Generation Hybrid Dominant Yellow Recessive Green Biology Science Education Vector
Vector, 2.84MB, 2860 × 2118 eps
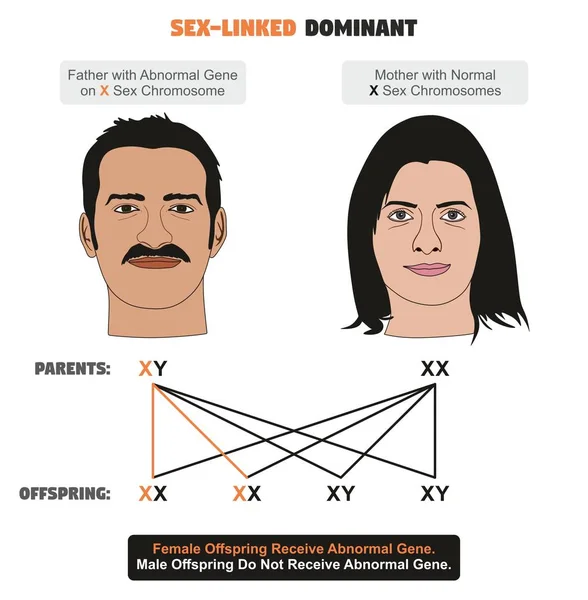
Sex-linked Dominant Hereditary Trait Infographic Diagram Showing Father With Abnormal Gene On X Sex Chromosome While Mother Has Normal Ones For Genetics And Medical Science Education
Vector, 0.34MB, 2022 × 2063 eps

Biological Inheritance Vector Illustration Infographic. Biology Education.
Vector, 5.7MB, 3800 × 4236 eps
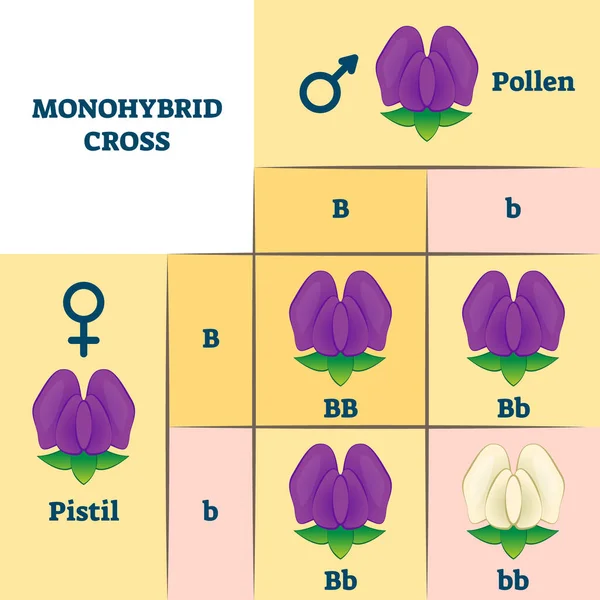
Monohybrid Cross Vector Illustration. Educational Plants Gene Mix Scheme.
Vector, 6.1MB, 4000 × 4000 eps

Incomplete Dominance Infographic Diagram Example Andalusian Chicken Gene Allele Non Is Dominant Third Phenotype Parent Black White Feather Hybrid Grey Heredity Biology Genetic Science Education Vector
Vector, 2.79MB, 2476 × 2458 eps

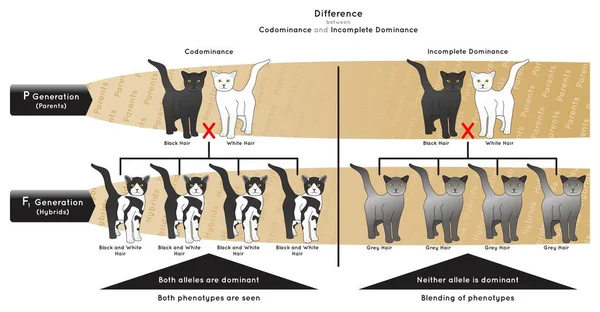
Difference Between Codominance And Incomplete Dominance Infographic Diagram Example Black White Cat Allele Dominant Phenotype Blending Parent Hybrid Gametes Heredity Genetic Science Education Vector
Vector, 2.95MB, 3400 × 1772 eps
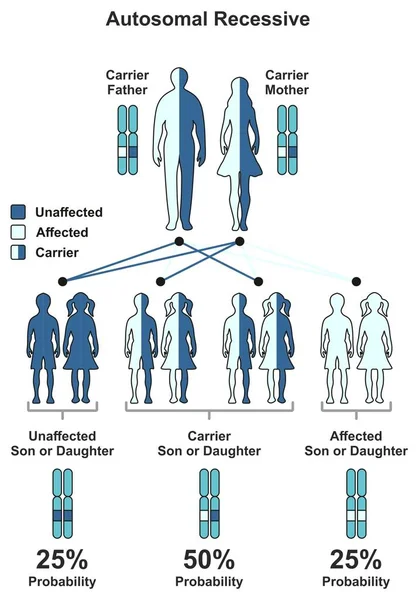
Autosomal Recessive Hereditary Trait Infographic Diagram Including Parents Father And Mother Probability Of Son And Daughter To Be Affected Unaffected Or Carrier For Genetic Science Education
Vector, 0.4MB, 1694 × 2420 eps
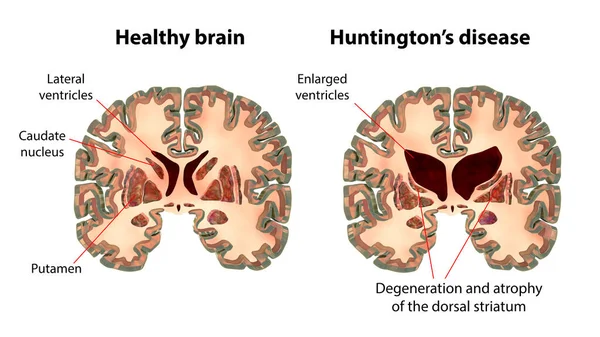
Coronal Sections Of A Healthy Brain And A Brain In Huntington's Disease Showing Enlarged Anterior Horns Of The Lateral Ventricles, Degeneration And Atrophy Of The Dorsal Striatum, 3D Illustration
Image, 10.57MB, 11104 × 6246 jpg
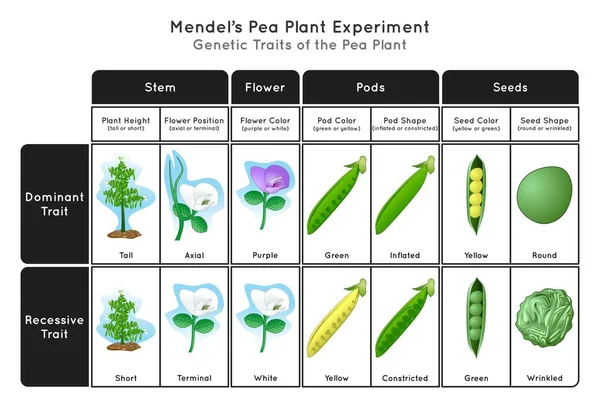
Genetic Trait Pea Plant Mendel Experiment Infographic Diagram Stem Height Flower Position Color Pod Seed Shape And Color Showing Dominant Or Recessive Traits Concept Biology Science Education Vector
Vector, 8.64MB, 2976 × 2028 eps

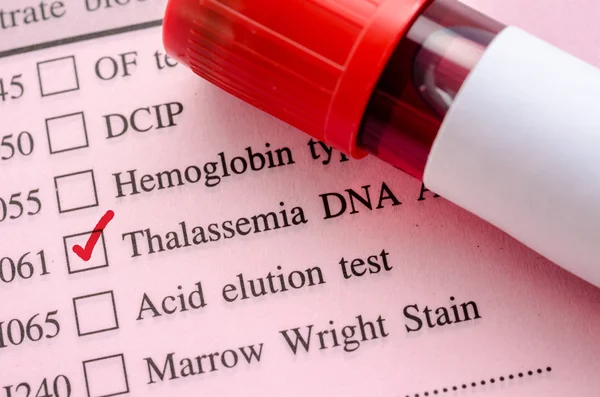
Inherited Disease Text With Document Brown Envelope And Stethoscope Isolated On Office Desk.
Image, 4.75MB, 6000 × 4000 jpg
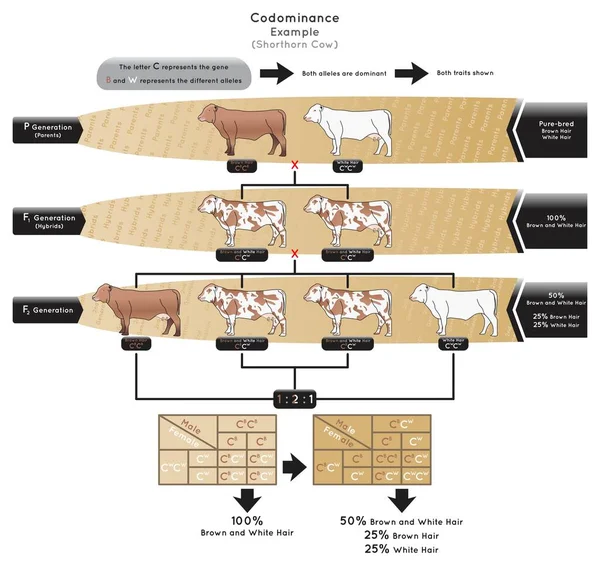
Codominance Infographic Diagram Example Shorthorn Cow Represent Gene Different Allele Both Dominant Both Trait Shown Brown White Hair Parent Hybrid Gametes Heredity Genetic Science Education Vector
Vector, 3.54MB, 2550 × 2406 eps

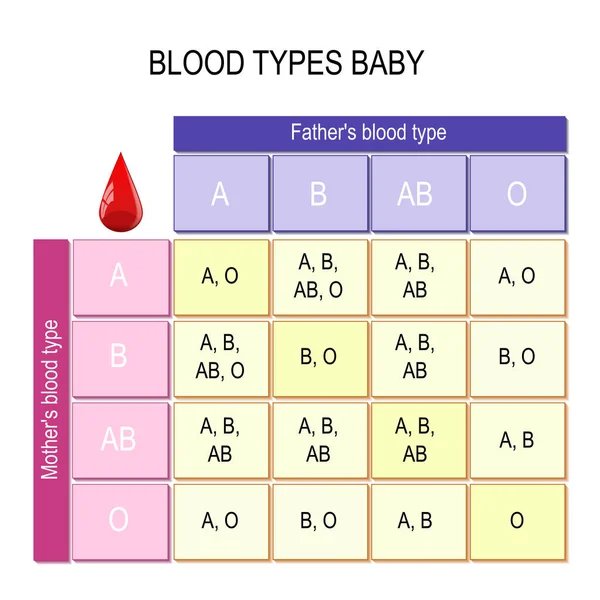
Blood Types Baby. Chart. How Mother And Father Blood Types Impact Blood Type Of Their Children. Vector Diagram Showing The Potential Outcomes. Illustration For Educational, Science And Medical Use
Vector, 0.48MB, 5336 × 5335 eps

Biology, Heredity Combination, Mendelian Genetics, Heredity, Peas Experiment, Genotype, Generation Inheritance, Dominant, Recessive Gen, Round, Next Generation Question Template, Exam Question, Eps
Vector, 6.59MB, 2100 × 2500 eps


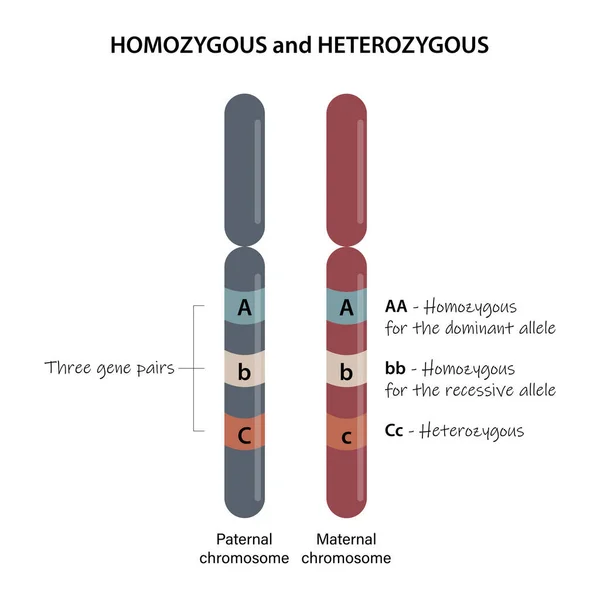
Homozygous And Heterozygous. A Comparison Of Homologous Chromosomes.
Vector, 5.49MB, 10417 × 10417 eps
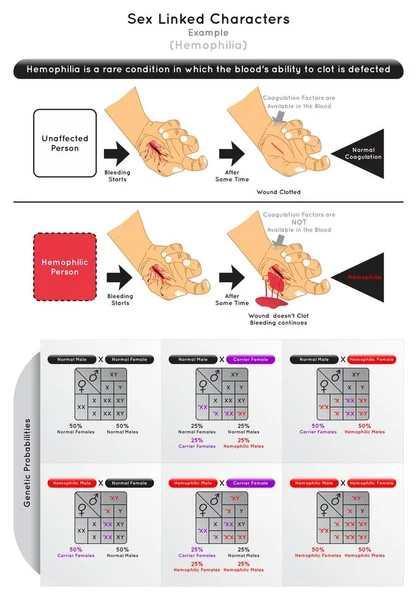
Sex Linked Characters Infographic Diagram Example Hemophilia Bleeding Wound Clot Coagulation Factor Hemophilic Male Female Punnett Square Genetic Probability Heredity Gene Science Education Vector
Vector, 2.13MB, 2068 × 2976 eps
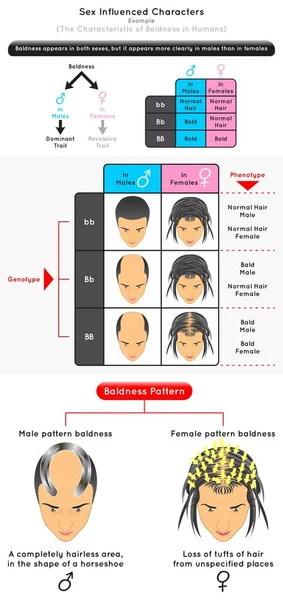
Sex Influenced Characters Infographic Diagram Example Characteristic Of Baldness In Human Dominant Trait Male Recessive Female Bald Genotype Phenotype Pattern Heredity Genetic Science Education Vector
Vector, 1.89MB, 1700 × 3604 eps
Page 1 >> Next