
Stock image Trading Volume

Finger Pointing On Stock Exchange Market Chart Investment Trading For Take A Profit With Trading Long Or Short Order Position On Computer Monitor Screen
Image, 6.98MB, 5778 × 3852 jpg


Working Set For Analyzing Financial Statistics And Analyzing A Market Data.
Image, 2.64MB, 3543 × 2362 jpg

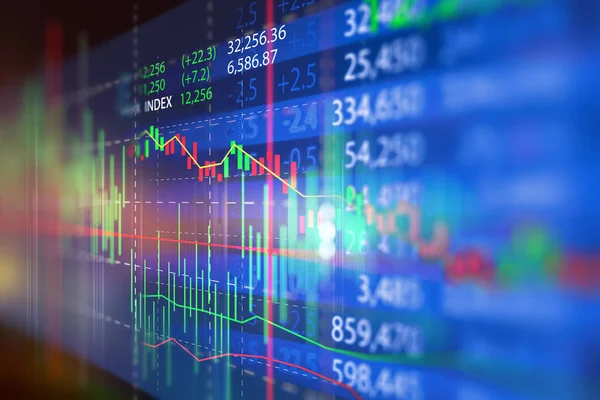
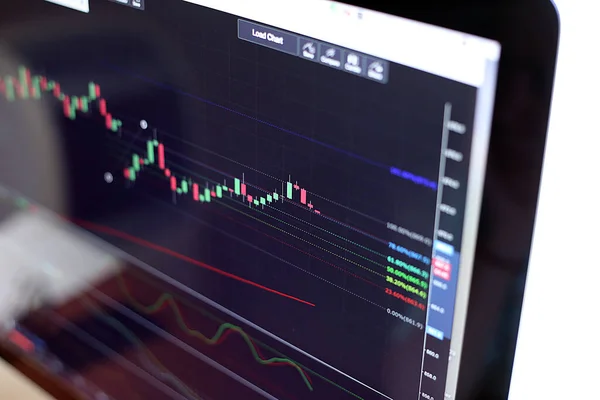
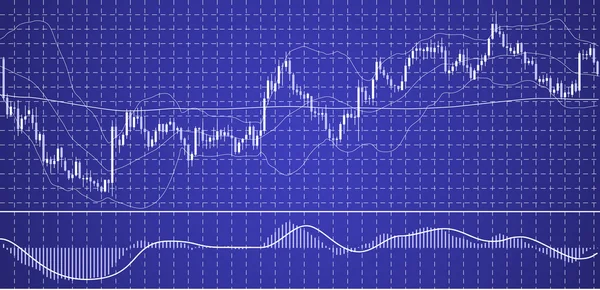
Financial Stock Market Graph Illustration ,concept Of Business Investment And Stock Future
Image, 8.73MB, 6000 × 4000 jpg


Volume Icon In Trendy Design Style. Volume Icon Isolated On White Background. Volume Vector Icon Simple And Modern Flat Symbol For Web Site, Mobile, Logo, App, UI. Volume Icon Vector Illustration, EPS10.
Vector, 0.56MB, 6944 × 6944 eps
Illustration Of Keyword ETF On Dark Blue Abstract Background - Business Concept.
Image, 17.43MB, 7000 × 4000 jpg
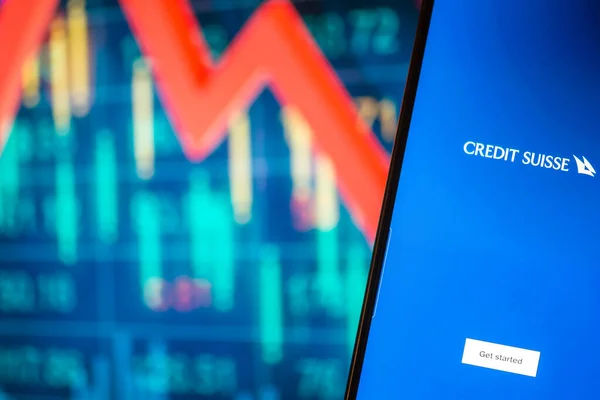
Galati, Romania - March 15, 2023: Smartphone With Credit Suisse Bank Logo. Credit Suisse Stock Chart On The Background.
Image, 18.12MB, 5360 × 3577 jpg

Illustration Of Keyword ETF On Dark Red Abstract Background - Business Concept.
Image, 15.91MB, 7000 × 4000 jpg

Illustration Of Keyword ETF On Dark Green Abstract Background - Business Concept.
Image, 19.87MB, 7000 × 4000 jpg

3d Rendering Of A White Keyboard With A Black Key And The Inscription ETF.
Image, 5.25MB, 5760 × 3840 jpg

Illustation Of Exchange Traded Fund (ETF) Keywords Cloud With White And Green Text On Dark Background.
Image, 10.69MB, 7000 × 4000 jpg

Stock Market Investment Graph On Financial Numbers Abstract Background.3d Illustratio
Image, 10.46MB, 5500 × 4500 jpg

Financial Stock Market Graph Illustration ,concept Of Business Investment And Stock Future
Image, 6.55MB, 6000 × 4000 jpg

Abstract Virtual Financial Graph Hologram On Dark Background, Forex And Investment Concept. 3D Rendering
Image, 1.48MB, 4500 × 3000 jpg

Stock Market Investment Graph On Financial Numbers Abstract Background.3d Illustratio
Image, 8.24MB, 6500 × 4800 jpg

Financial Stock Market Graph On Laptop Screen Represent Concept Of Business Investment And Stock Future Trading.
Image, 9.96MB, 6500 × 4500 jpg

Financial Stock Market Graph On Laptop Screen Represent Concept Of Business Investment And Stock Future Trading.
Image, 8.58MB, 6500 × 4500 jpg

Financial Stock Market Graph On Laptop Screen Represent Concept Of Business Investment And Stock Future Trading.
Image, 9.32MB, 6500 × 4500 jpg

Financial Stock Market Graph Illustration ,concept Of Business Investment And Stock Future Trading
Image, 6.97MB, 6500 × 4800 jpg

Stock Market Investment Graph On Financial Numbers Abstract Background.3d Illustratio
Image, 7.43MB, 7000 × 4500 jpg

Double Exposure Image Of Stock Market Investment Graph And City Skyline Scene,concept Of
Image, 8.74MB, 6000 × 5000 jpg
Financial Stock Market Graph Illustration ,concept Of Business Investment And Stock Future
Image, 4.06MB, 4500 × 3000 jpg


Financial Stock Market Graph Illustration ,concept Of Business Investment And Stock Future Trading
Image, 11.34MB, 6500 × 4800 jpg

Financial Stock Market Graph Illustration ,concept Of Business Investment And Stock Future Trading
Image, 11.6MB, 6500 × 4800 jpg

Vector Illustration. Flat Background. Market Trade. Trading Platform And Account. Moneymaking,business. Market Analysis. Investing.
Vector, 5.11MB, 4000 × 1594 eps

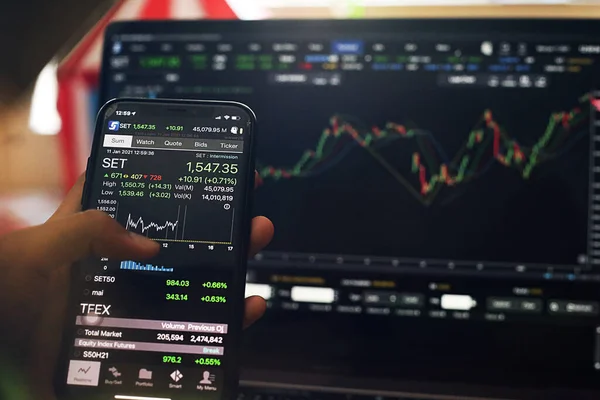
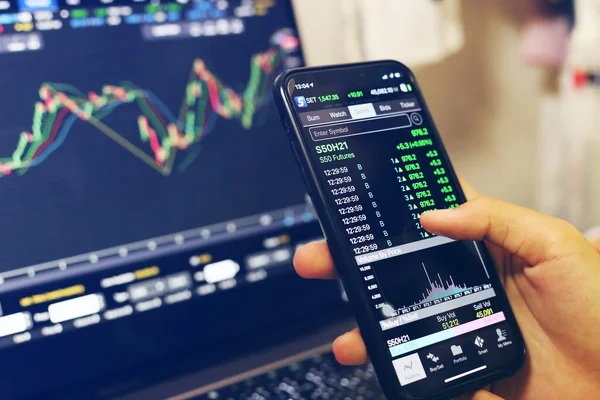
January 11, 2021Thai Stock Indices Are Slowly Moving Upward. After A Week Ago Adjusted Hard For One Time.However, Analysts Say The Stock Is Still Bullish.
Image, 9.72MB, 5472 × 3648 jpg

Candle Stick Graph Chart Of Stock Market Investment Trading, Bullish Point, Bearish Point. Trend Of Graph
Image, 29.1MB, 5471 × 3648 jpg

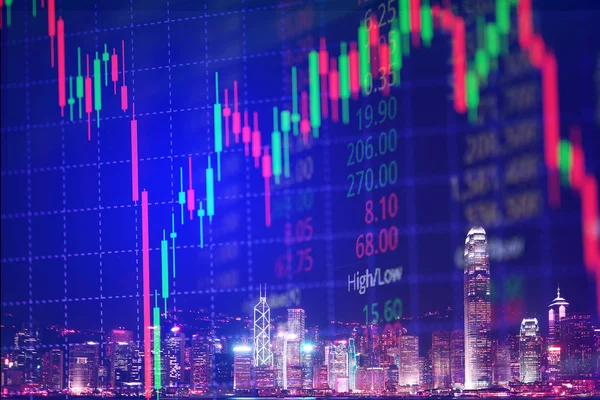
Double Exposure Image Of Stock Market Investment Graph And City Skyline Scene,concept Of Business Investment And Stock Future Trading
Image, 4.74MB, 4096 × 2160 jpg

Double Exposure Image Of Stock Market Investment Graph And City Skyline Scene,concept Of
Image, 11.9MB, 6500 × 4800 jpg
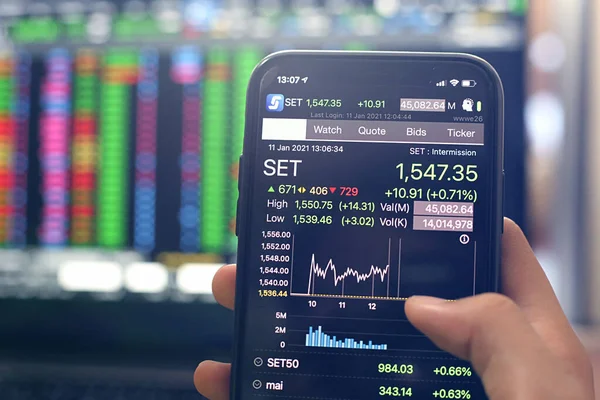
January 11, 2021Thai Stock Indices Are Slowly Moving Upward. After A Week Ago Adjusted Hard For One Time.However, Analysts Say The Stock Is Still Bullish.
Image, 8.14MB, 5472 × 3648 jpg


Candle Stick Graph Chart Of Stock Market Investment Trading Business Finance And Investment Concept
Image, 7.3MB, 5472 × 3648 jpg
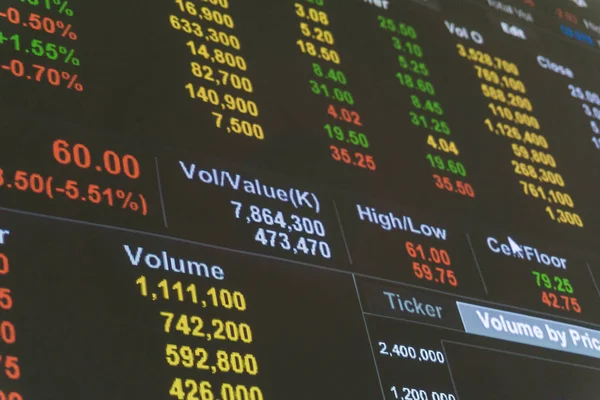
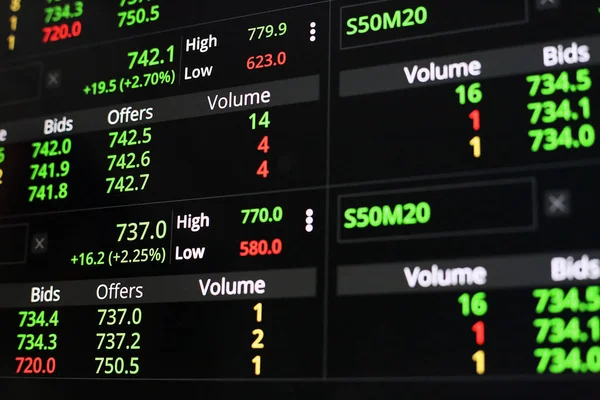
The Stock Exchange, Streaming Trade Screen, The Stock Screen Show The Stock Price Rise.
Image, 8.74MB, 5472 × 3648 jpg
January 11, 2021Thai Stock Indices Are Slowly Moving Upward. After A Week Ago Adjusted Hard For One Time.However, Analysts Say The Stock Is Still Bullish.
Image, 7.63MB, 5472 × 3648 jpg


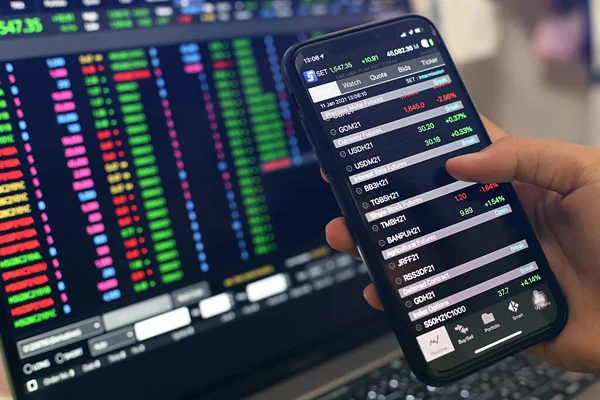
Thailand Stock Exchange, Streaming Trade Screen, The Stock Screen Shows A List Of Stocks With Reduced Value.
Image, 8.07MB, 5472 × 3648 jpg
January 11, 2021Thai Stock Indices Are Slowly Moving Upward. After A Week Ago Adjusted Hard For One Time.However, Analysts Say The Stock Is Still Bullish.
Image, 8.97MB, 5472 × 3648 jpg

After News Of Covid 19 Vaccine Production Came Out, The Thai Stock Market Had Rallied More Than 38 Points Yesterday, While Today, 6 January 2021, The Stock Market Fell Slightly In The Morning.
Image, 5.6MB, 5472 × 3648 jpg

Stock Market Forex Trading Chart Financial Investment Business Concept Economic And Financial Trends 3d Illustration
Image, 3.6MB, 7000 × 3500 jpg

Working Set For Analyzing Financial Statistics And Analyzing A Market Data.
Image, 5.48MB, 5315 × 3543 jpg
Thailand Stock Exchange, Streaming Trade Screen, The Stock Screen Shows A List Of Stocks With Reduced Value.
Image, 9.53MB, 5472 × 3648 jpg
Page 1 >> Next