
Stock image Trading Volume page 2


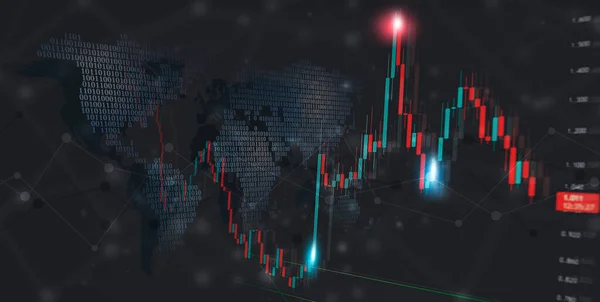
Stock Market Investment Graph On Financial Numbers Abstract Background.3d Illustratio
Image, 5.6MB, 5760 × 3240 jpg

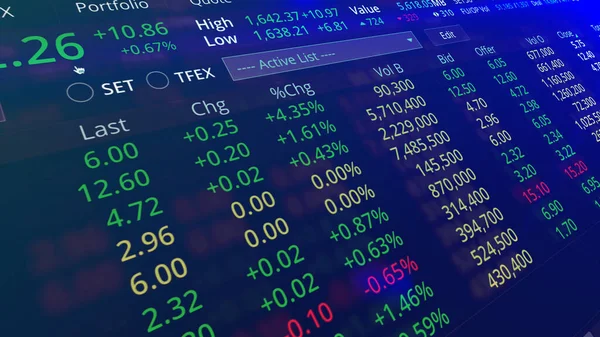
Working Set For Analyzing Financial Statistics And Analyzing A Market Data.
Image, 2.24MB, 3543 × 2362 jpg

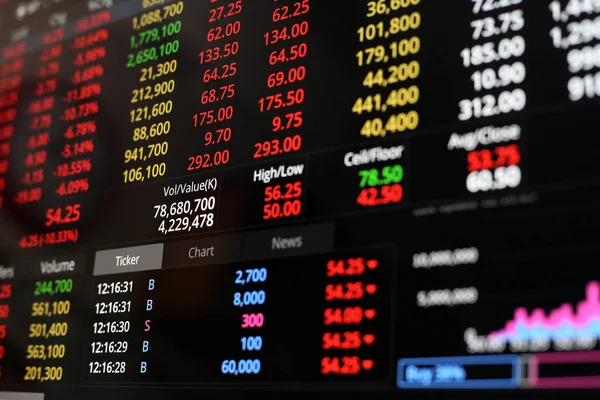
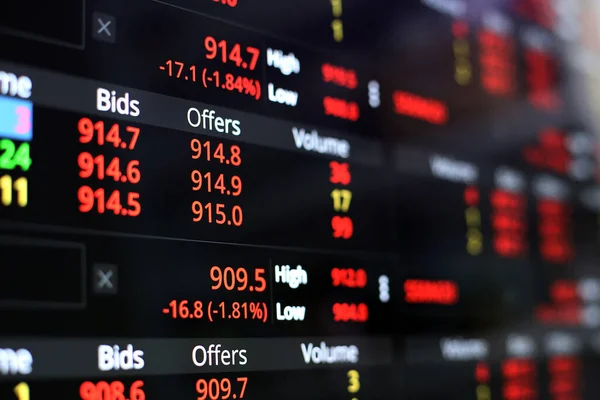
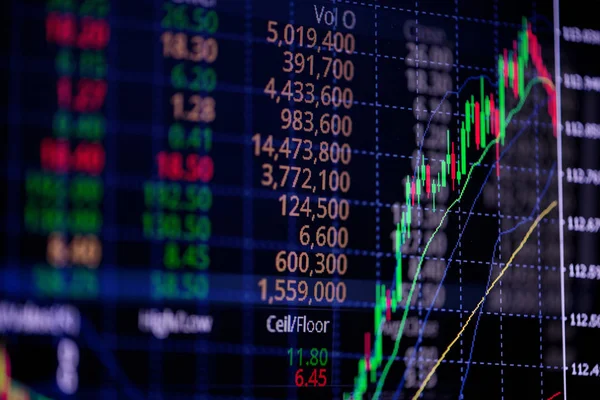
The Stock Exchange, Streaming Trade Screen, The Stock Screen Show The Stock Price Rise.
Image, 5.83MB, 5472 × 3648 jpg

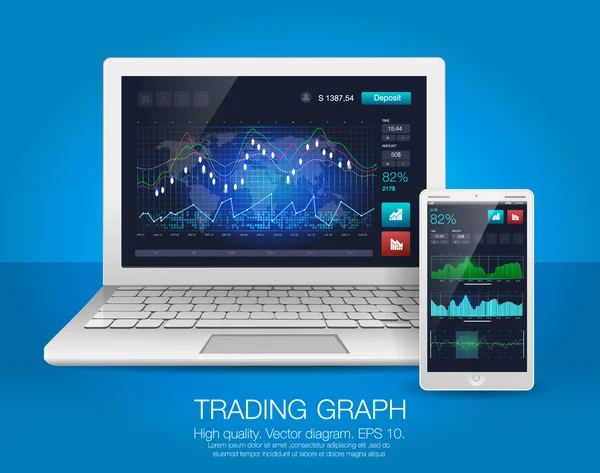
Laptop And Smartphone With HUD UI For Business App. Futuristic User Interface And Infographic Elements. Abstract Virtual Graphic Touch User Interface. UI Hud Infographic Interface Screen Monitor Radar Set Web Elements
Vector, 23.1MB, 4000 × 3156 eps
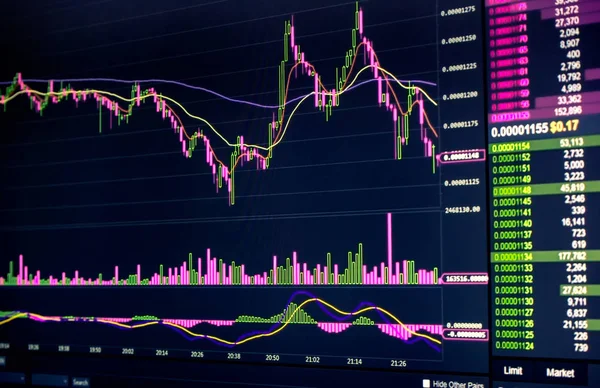
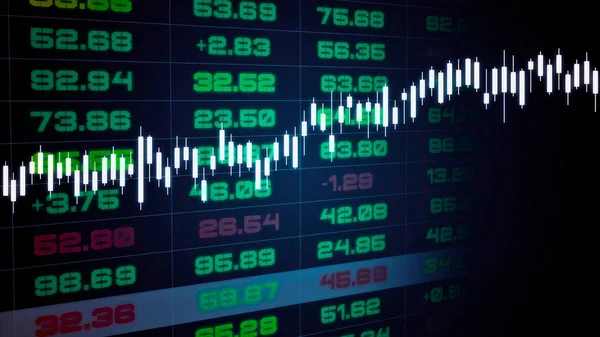
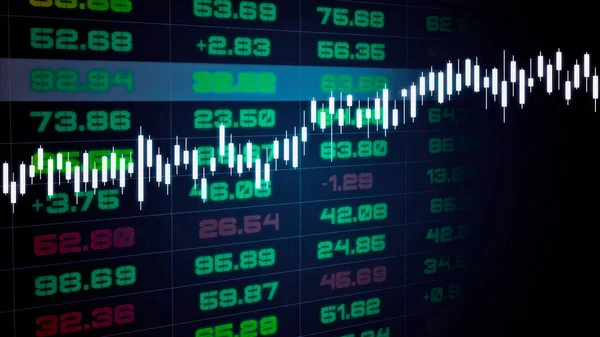
Candle Stick Graph Chart Of Stock Market Investment Trading, Bullish Point, Bearish Point. Trend Of Graph
Image, 6.04MB, 5412 × 3504 jpg

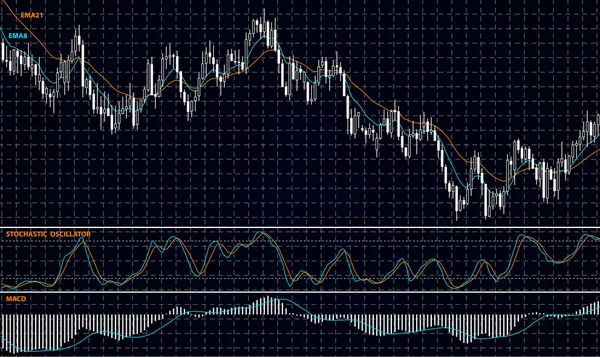
Candle Stick Graph Chart With Indicator Showing Bullish Point Or Bearish Point, Up Trend Or Down Trend Of Price Of Stock Market Or Stock Exchange Trading, Investment And Financial Concept.
Image, 8.22MB, 6000 × 4000 jpg

Stock Market Investment Graph On Financial Numbers Abstract Background.3d Illustratio
Image, 5.1MB, 5000 × 3400 jpg

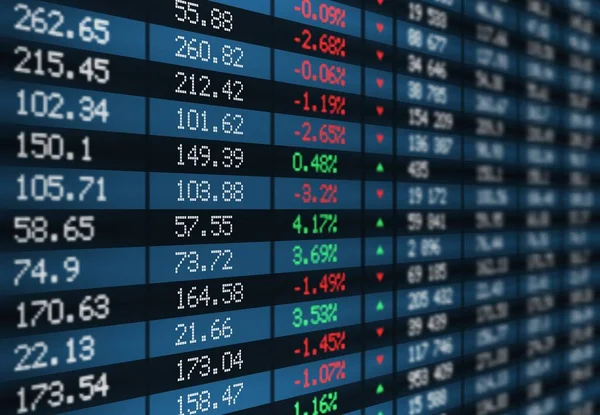
Thailand Stock Exchange, Streaming Trade Screen, The Stock Screen Shows A List Of Stocks With Reduced Value.
Image, 6.71MB, 5472 × 3648 jpg
Stock Exchange, Streaming Trade Screen, The Stock Screen Shows A List Of Stocks With Reduced Value.
Image, 5.96MB, 5472 × 3648 jpg

Financial Stock Market Graph Illustration ,concept Of Business Investment And Stock Future Trading
Image, 7.7MB, 5000 × 4000 jpg

Working Set For Analyzing Financial Statistics And Analyzing A Market Data.
Image, 2.89MB, 3543 × 2362 jpg

Working Set For Analyzing Financial Statistics And Analyzing A Market Data.
Image, 2.84MB, 5315 × 3543 jpg

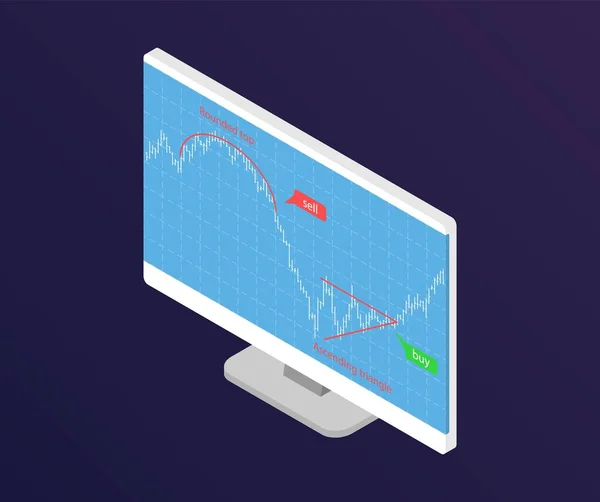
Abstract Background Of Stock Market Buying And Selling Climax And Technical Analysis Chart Graph
Vector, 10.52MB, 6000 × 3375 eps
Laptop And Smartphone With Heads-Up Display UI. Futuristic User Interface And Infographic Elements For Business Application. Abstract Virtual Graphic Touch Screen Monitor Radar Set Web Elements
Vector, 8.23MB, 4000 × 3156 eps

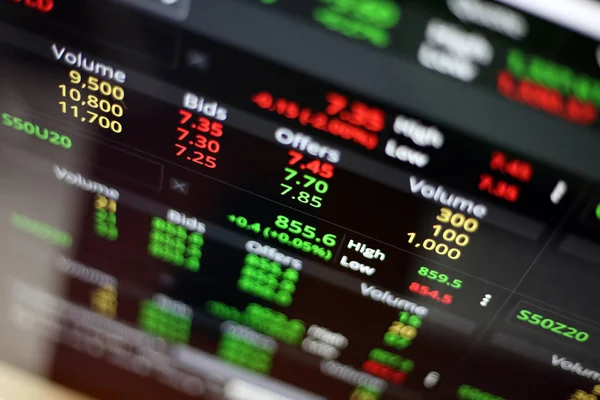
The Stock Exchange, Streaming Trade Screen, The Stock Screen Show The Stock Price Rise.
Image, 5.66MB, 5472 × 3648 jpg

Working Set For Analyzing Financial Statistics And Analyzing A Market Data.
Image, 3.34MB, 3543 × 2362 jpg


Working Set For Analyzing Financial Statistics And Analyzing A Market Data.
Image, 1.34MB, 3543 × 2362 jpg

Working Set For Analyzing Financial Statistics And Analyzing A Market Data.
Image, 4.56MB, 5315 × 3543 jpg

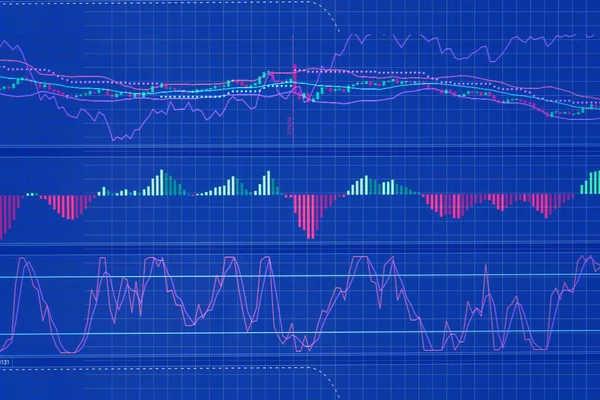
Financial And Technology Concept With Graphs And Charts On Blue Background
Image, 7.95MB, 5000 × 3000 jpg
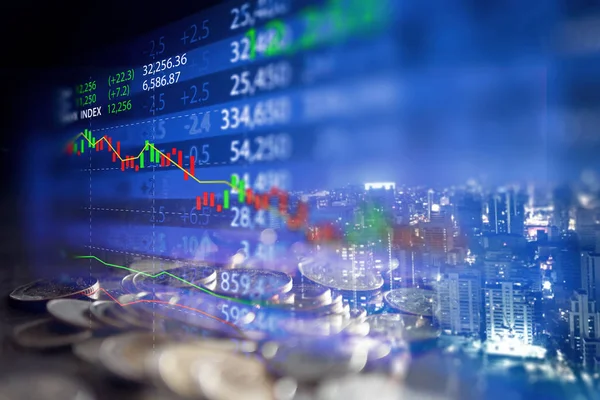
Double Exposure Image Of Stock Market Investment Graph And Coins Stack,concept Of Business
Image, 9.18MB, 6000 × 4000 jpg

The Stock Exchange, Streaming Trade Screen, The Stock Screen Show The Stock Price Rise.
Image, 5.49MB, 5472 × 3648 jpg

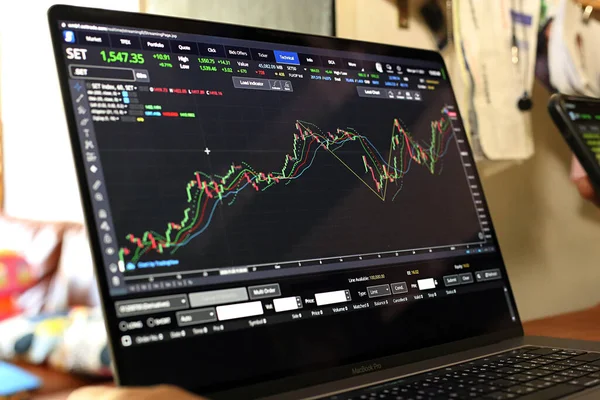
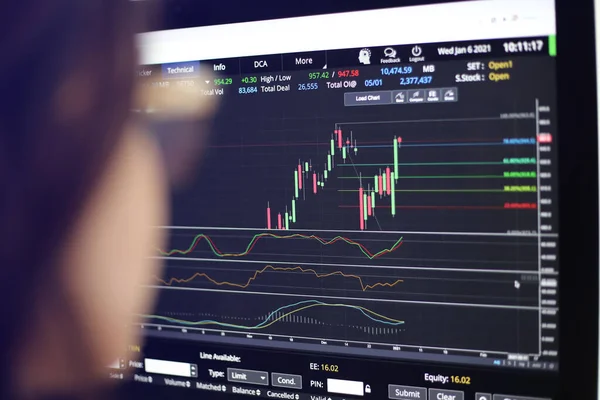
January 11, 2021Thai Stock Indices Are Slowly Moving Upward. After A Week Ago Adjusted Hard For One Time.However, Analysts Say The Stock Is Still Bullish.
Image, 7.66MB, 5472 × 3648 jpg
Stock Exchange Board Vector Display With Financial Market Index Charts And Graphs. Stock Market Ticker Screen With Green And Red Numbers Of Share Volume, Price Traded, Change Direction, Economy Themes
Vector, 12.91MB, 6360 × 4403 eps

Working Set For Analyzing Financial Statistics And Analyzing A Market Data.
Image, 8.56MB, 5315 × 3543 jpg
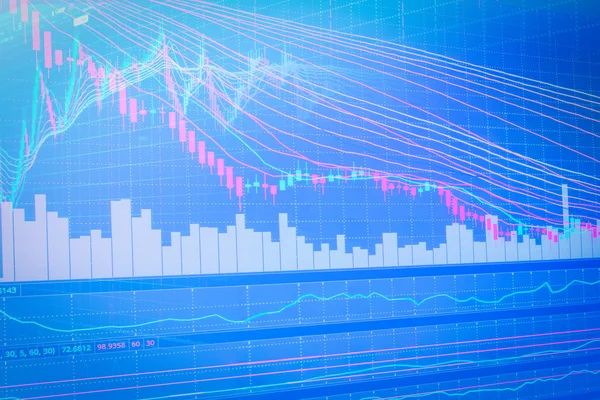
Finance Candles Chart Market. Business Finance Trading Graph Background
Image, 4.68MB, 5472 × 2760 jpg

Working Set For Analyzing Financial Statistics And Analyzing A Market Data.
Image, 2.52MB, 3543 × 2362 jpg

Stock Exchange, Streaming Trade Screen, The Stock Screen Shows A List Of Stocks With Reduced Value.
Image, 6.03MB, 5472 × 3648 jpg

Working Set For Analyzing Financial Statistics And Analyzing A Market Data.
Image, 5.49MB, 5315 × 3543 jpg
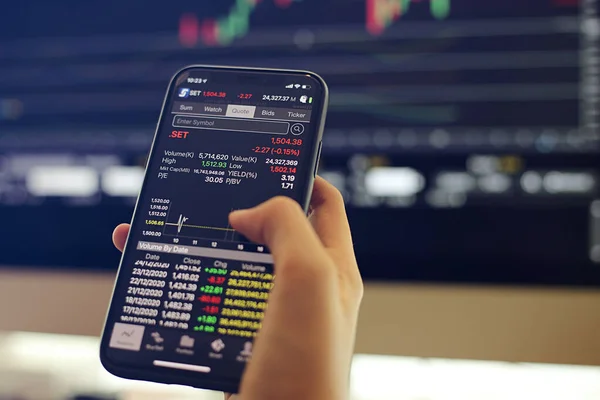
After News Of Covid 19 Vaccine Production Came Out, The Thai Stock Market Had Rallied More Than 38 Points Yesterday, While Today, 6 January 2021, The Stock Market Fell Slightly In The Morning.
Image, 5.46MB, 5472 × 3648 jpg

Thailand Stock Exchange, Streaming Trade Screen, The Stock Screen Shows A List Of Stocks With Reduced Value.
Image, 11.29MB, 5472 × 3648 jpg


Working Set For Analyzing Financial Statistics And Analyzing A Market Data.
Image, 2.79MB, 3543 × 2362 jpg

Financial Stock Market Graph Illustration ,concept Of Business Investment And Stock Future Trading
Image, 14.91MB, 6000 × 4671 jpg
After News Of Covid 19 Vaccine Production Came Out, The Thai Stock Market Had Rallied More Than 38 Points Yesterday, While Today, 6 January 2021, The Stock Market Fell Slightly In The Morning.
Image, 4.92MB, 5472 × 3648 jpg
Previous << Page 2 >> Next