
Stock image Transduction page 2

CAMP Cyclic Adenosine MonoPhosphate - Second Messenger Important In Many Biological Processes, Acronym Text On Blackboard
Image, 11.5MB, 5760 × 3840 jpg
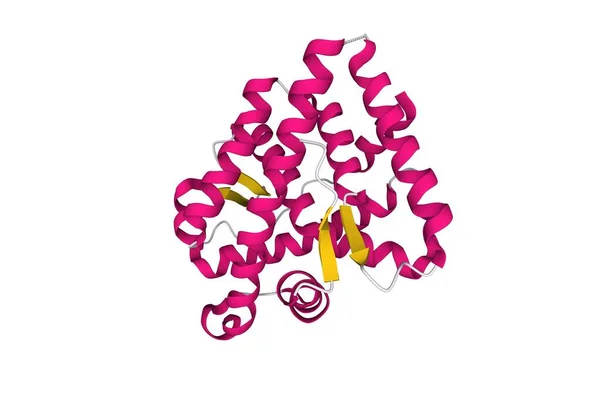
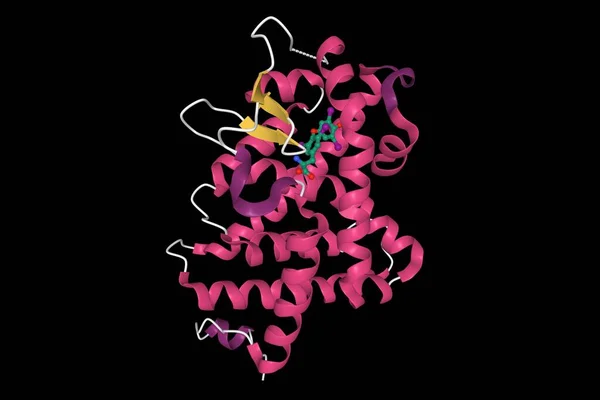
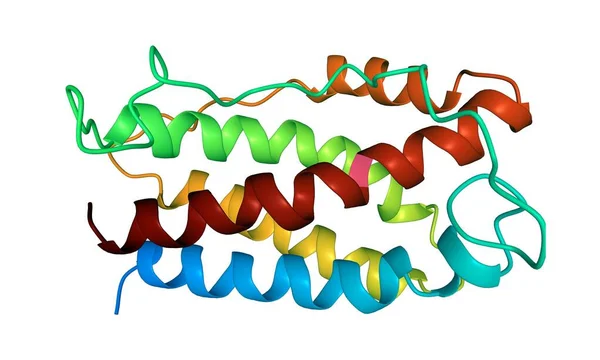
Structure Of The Human Androgen Receptor, 3D Cartoon Model With The Differently Colored Elements Of The Secondary Structure, White Background
Image, 1.8MB, 6000 × 4000 jpg
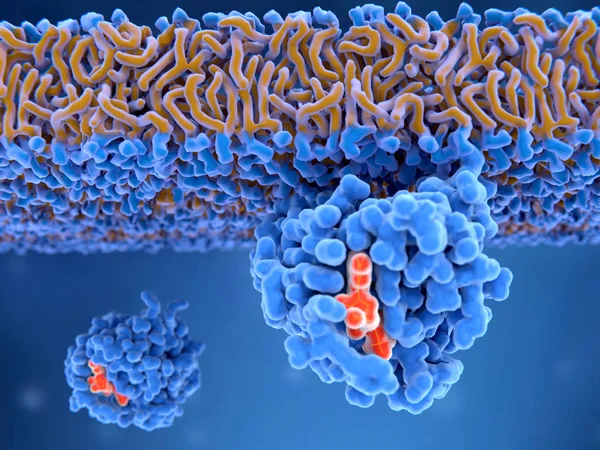
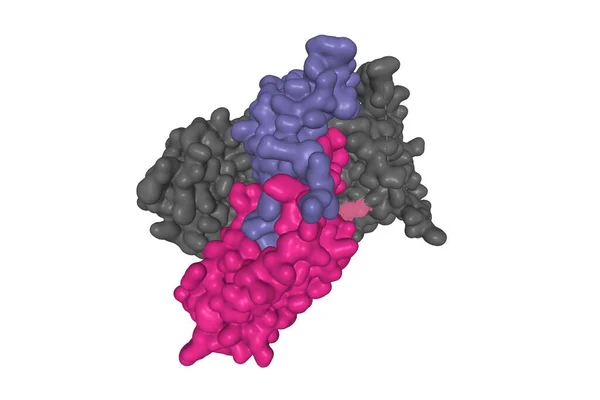
3d Computer Illustration Of An Activated Ras Protein. Ras Proteins Are Involved In Transmitting Signals Within Cells Turning On Genes Involved In Cell Growth, Differentiation And Survival. Mutations In Ras Genes Can Lead To Permanently Activated Prot
Image, 4.61MB, 8000 × 6000 jpg

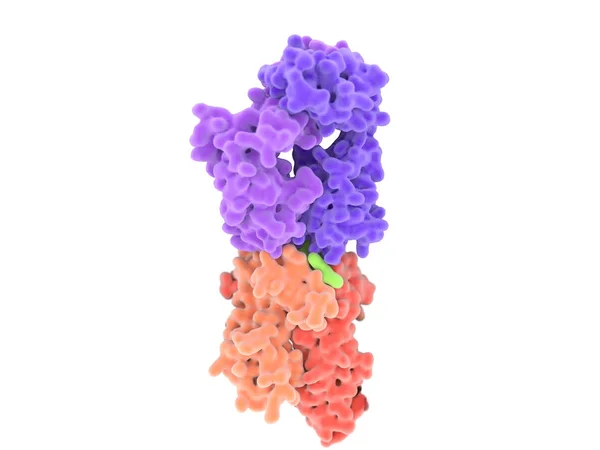
T-cell Receptor In Complex With The MHC Class II-peptide Complex. The Antigen (light Green) Is A Peptide From A Tumor Cell, Bacteria Or Virus. Different Stages Of The Interaction. 3D-Rendering. Illustration
Image, 7.31MB, 8000 × 6000 jpg
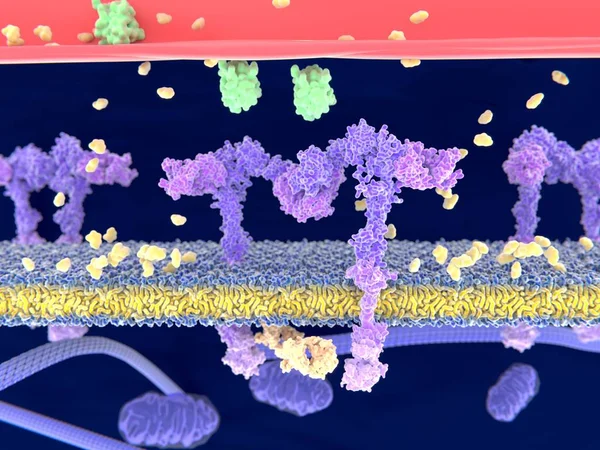
Insulin (green) Binding To The Insulin Receptor (violet) Activates The Transport Of Glucose (yellow) Into The Cell (depicted In 2 Phases) - Illustration
Image, 4.57MB, 4000 × 6200 jpg
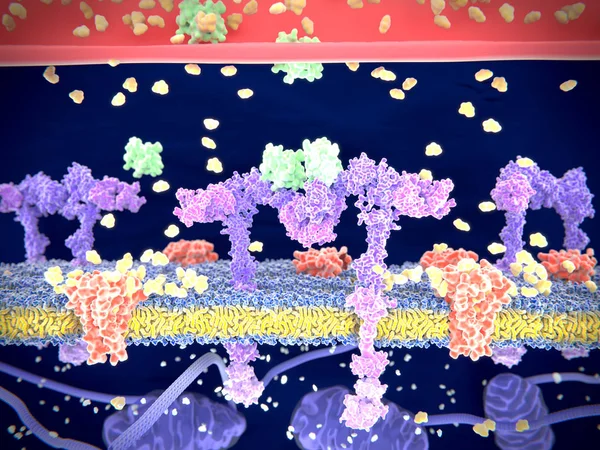
Insulin (green) Binding To The Insulin Receptor (violet) Activates The Transport Of Glucose (yellow) Into The Cell. Illustration
Image, 6.21MB, 8000 × 6000 jpg
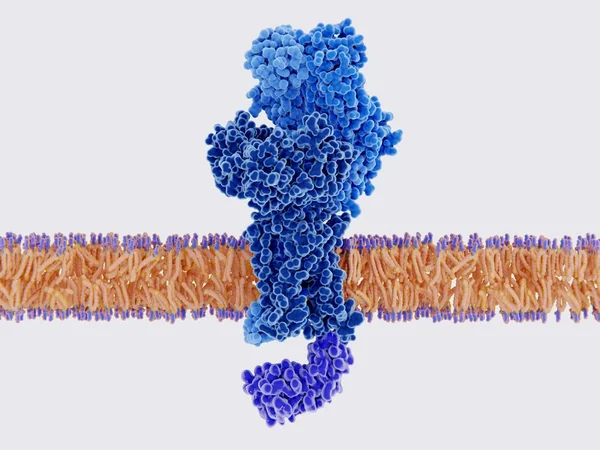
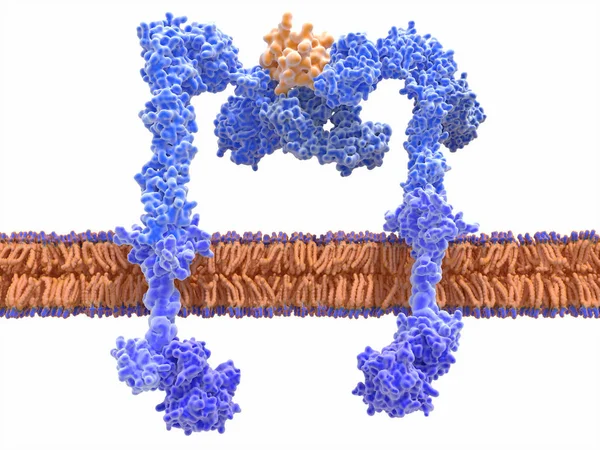
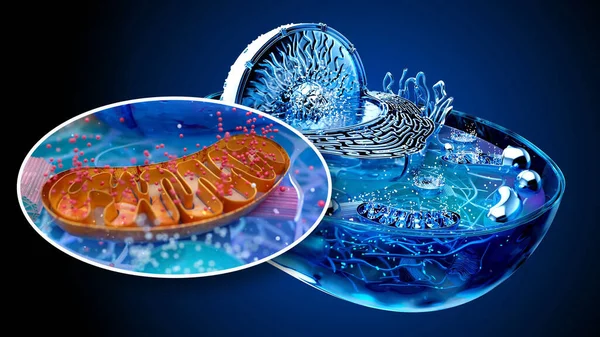
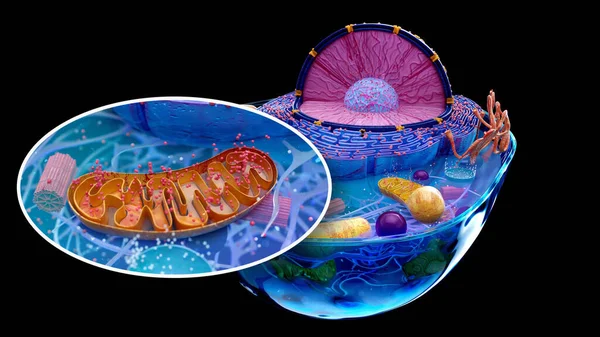
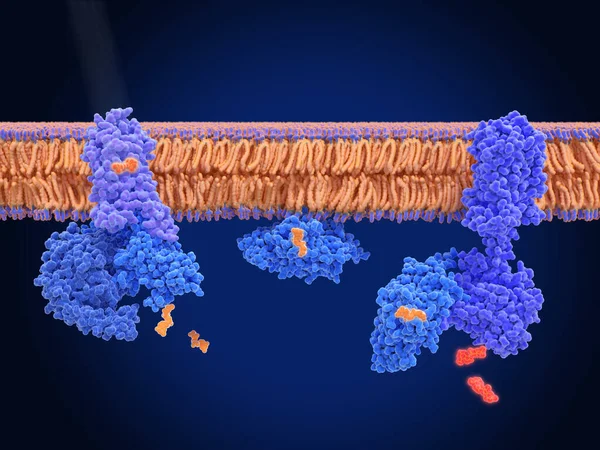
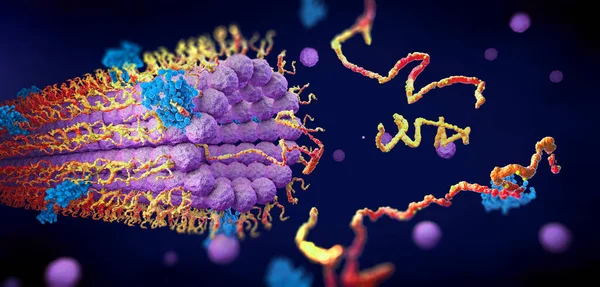
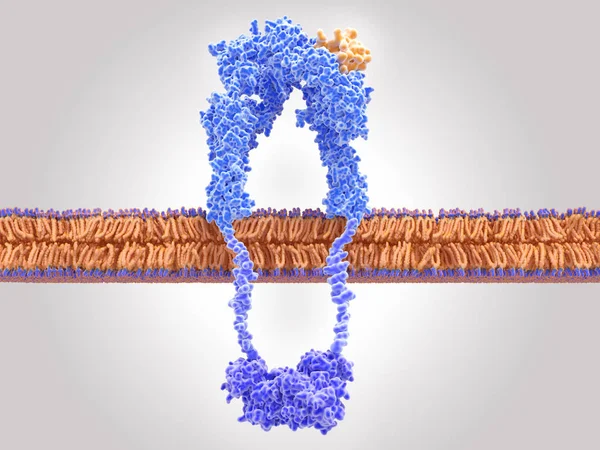
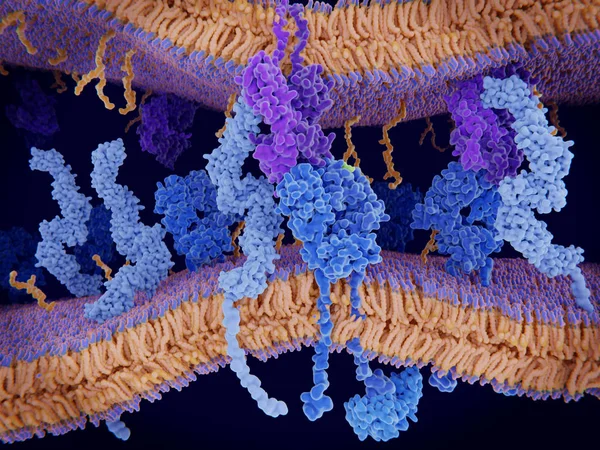
The Insulin Receptor (blue) Is A Transmembrane Protein, That Is Activated By Insulin (orange). Insulin Binding Induces Structural Changes Within The Receptor That Finally Leads To The Activation Of The Glucose Transporter Protein.
Image, 12.2MB, 8000 × 6000 jpg
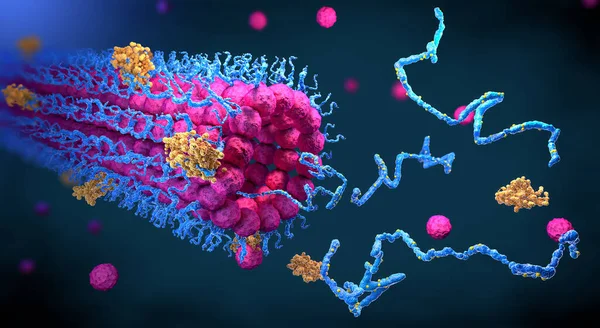
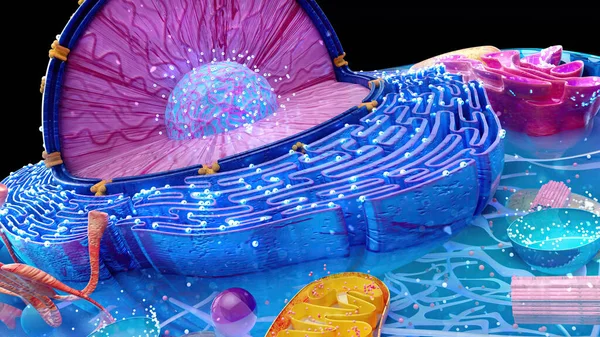
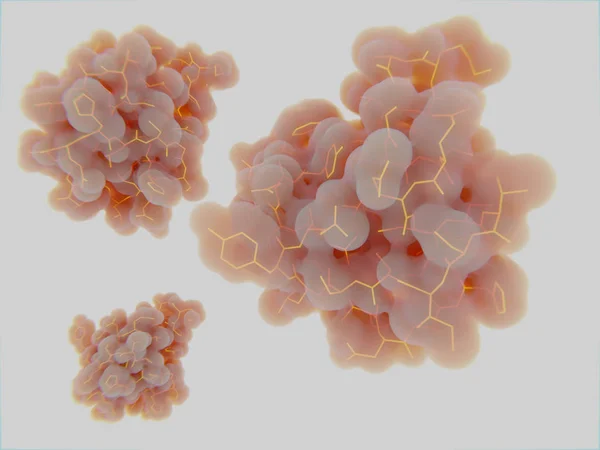
Protein Enzymes Fold Into Their Structure To Fulfill Their Function - 3d Illustration
Image, 13.4MB, 7300 × 4000 jpg
T-cell Receptor In Complex With The MHC Class II-peptide Complex. The Antigen (light Green) Is A Peptide From A Tumor Cell, Bacteria Or Virus. Different Stages Of The Interaction. 3D-Rendering. Illustration
Image, 2.17MB, 8000 × 6000 jpg

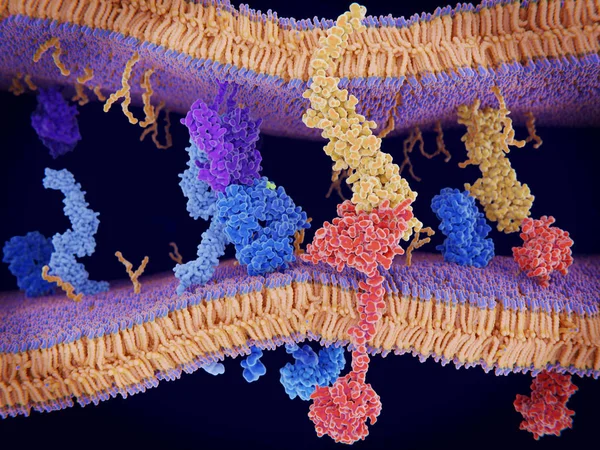
PD-1 (red) Extends From The Surface Of A T-cell And Interacts With The Ligand Protein PD-L1 (yellow) From A Antigen Presenting Cell. Although The T-cell Has Been Activated Through The Interaction Of A T-cell Receptor (blue) And A MHC Protein (viole
Image, 18.32MB, 8000 × 6000 jpg

Hormones, Receptors And Target Cells. Each Type Of Hormone Is Designed Only Certain Cells. These Cells Will Have Receptors On Them That Are Specific For A Certain Hormone. Vector Illustration For Medical, Biological, And Educational Use
Vector, 2.77MB, 5013 × 5012 eps

Rhodopsin Is A Light Sensitive G-protein Coupled Receptor With Retinal As Cofactor. That Stimulates The G-protein Transducin, Resulting In The Liberation Of Its Subunit. This GTP-bound Subunit In Turn Activates CGMP Phosphodiesterase.
Image, 8.93MB, 8000 × 6000 jpg

Structure Of Human Interleukin-11, 3D Cartoon Model Isolated, White Background
Image, 2.35MB, 6000 × 4000 jpg
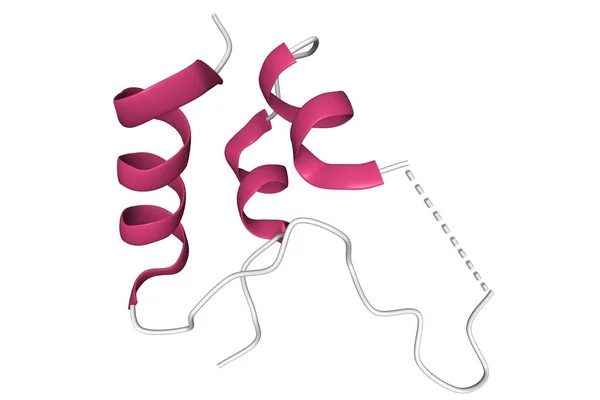
Structure Of Insulin-like Growth Factor 1 (IGF-1), 3D Cartoon Model Of The Tertiary Structure With The Elements Of The Secondary Structure Colored, White Background
Image, 1.25MB, 6000 × 4000 jpg
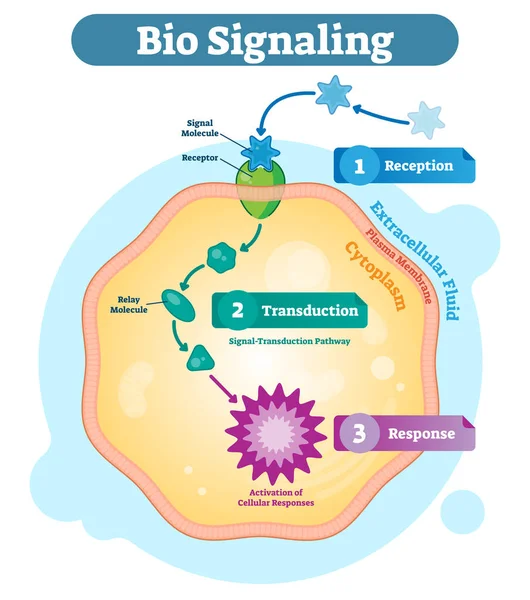
Bio Signaling Cell Communication Network System, Micro Biological Anatomy Labeled Diagram Vector Illustration With Receptor, Transduction And Response Activity.
Vector, 5.4MB, 4167 × 4709 eps
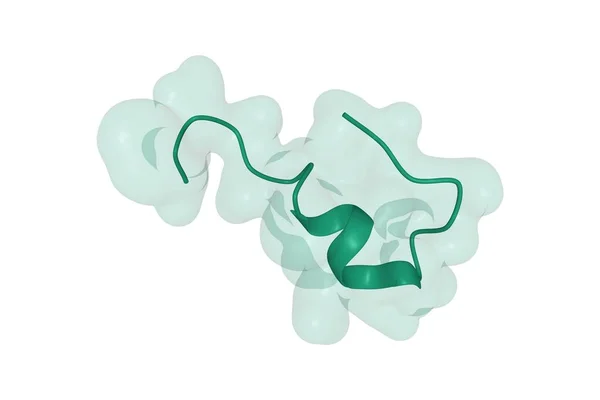
Structure Of Human Endothelin-1, A Polypeptide Hormone Regulator Of Blood Pressure, 3D Combined Surface-cartoon Model Isolated, White Background
Image, 1.2MB, 6000 × 4000 jpg
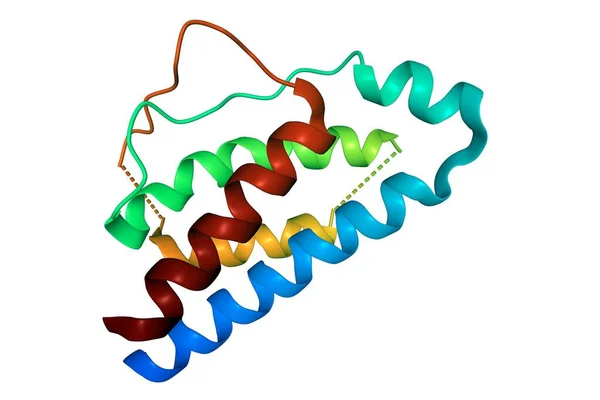
Structure Of Human Interleukin-2, 3D Cartoon Model Isolated, White Background
Image, 2.46MB, 6000 × 4000 jpg
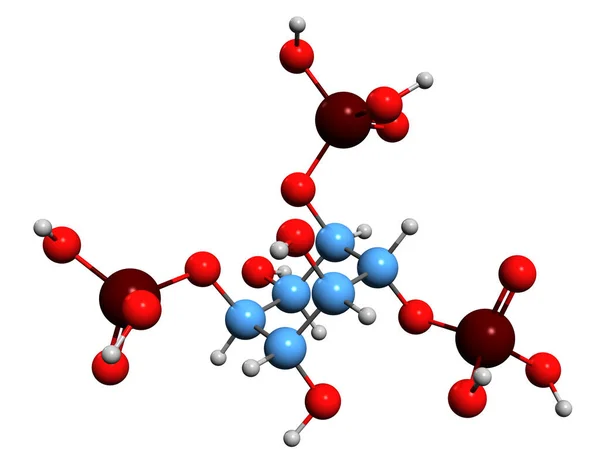
3D Image Of Inositol Trisphosphate Skeletal Formula - Molecular Chemical Structure Of Inositol Phosphate Signaling Molecule Isolated On White Background
Image, 3.87MB, 6943 × 5520 jpg
Protein Enzymes Fold Into Their Structure To Fulfill Their Function - 3d Illustration
Image, 10.02MB, 7300 × 3500 jpg
Insulin (green) Binding To The Insulin Receptor (violet) Activates The Transport Of Glucose (yellow) Into The Cell. Illustration
Image, 3.71MB, 8000 × 6000 jpg
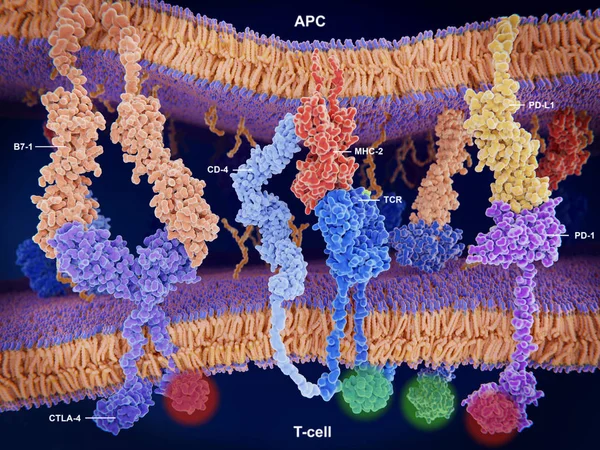
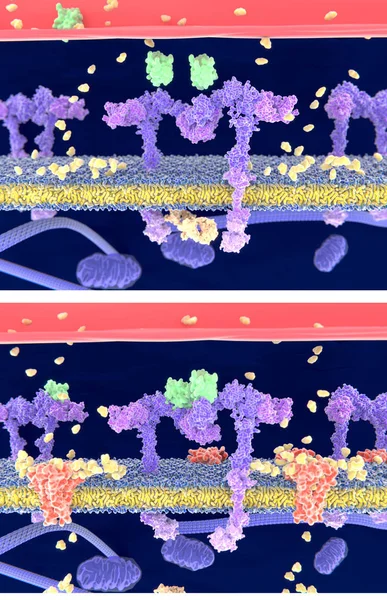
Interactions Of MHC-II With The T-cell Receptor And CD4 And B7-1 With CD-28 Activates T-cells While The Interactions Of P7-1 With CTLA-4 And PD-L1 With PD-1 Deactivates T-cells.
Image, 10.7MB, 8000 × 6000 jpg
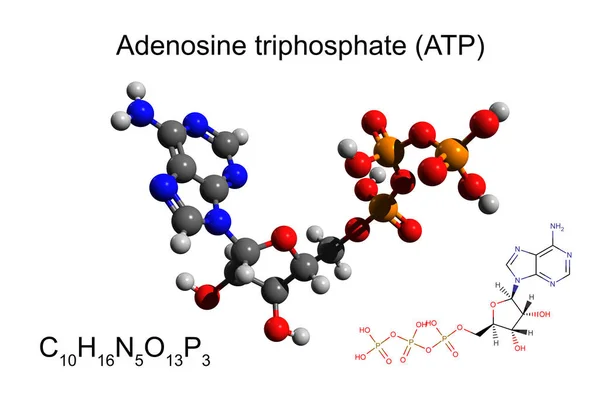
Chemical Formula, Skeletal Formula And 3D Ball-and-stick Model Of Adenosine Triphosphate (ATP), White Background
Image, 1.53MB, 6500 × 4500 jpg
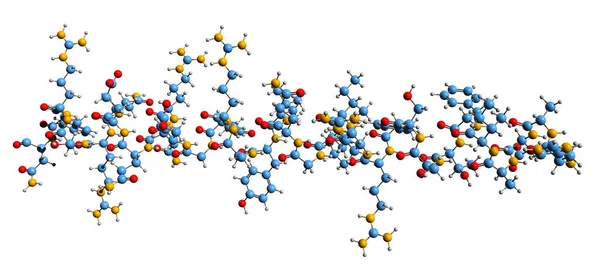
3D Image Of Somatotropin Releasing Hormone Skeletal Formula - Molecular Chemical Structure Of Peptide Hormone SRH Isolated On White Background
Image, 6.22MB, 10000 × 4488 jpg

Insulin (green) Binding To The Insulin Receptor (violet) Activates The Transport Of Glucose (yellow) Into The Cell (phase 1). Illustration
Image, 3.96MB, 8000 × 6000 jpg

Structure Of Human Interleukin-38, 3D Cartoon Model Isolated, White Background
Image, 1.94MB, 6000 × 4000 jpg

Crystal Structure Of SHOC2. D Cartoon Model, Secondary Structure Color Scheme, Pdb 7tvg, White Background
Image, 1.88MB, 6000 × 4000 jpg

Structure Of The Progesterone Receptor-DNA Complex, 3D Cartoon Model, White Background
Image, 2.66MB, 6349 × 4083 jpg

3d Computer Illustration Of An Activated Ras Protein With GTP Bound. Ras Proteins Are Involved In Transmitting Signals Within Cells Turning On Genes Involved In Cell Growth, Differentiation And Survival. Mutations In Ras Genes Can Lead To Permanentl
Image, 1.5MB, 8000 × 6000 jpg
Thyroxine-thyroid Hormone Receptor Interactions, 3D Cartoon Model, Black Background
Image, 1.71MB, 6000 × 4000 jpg

Activation Of The GABA B Receptor By Baclofen. GABA B Receptors Are G Protein-coupled Receptors. Binding Of An Agonist (baclofen, Red) Leads To A G-protein Coupled C-AMP Signaling Pathway. Source: PDB Entries 7eb2, 6r3q,.
Image, 9.97MB, 8000 × 6000 jpg
Structure Of Human Interleukin-6, 3D Cartoon Model Isolated, White Background
Image, 2.29MB, 5000 × 3000 jpg
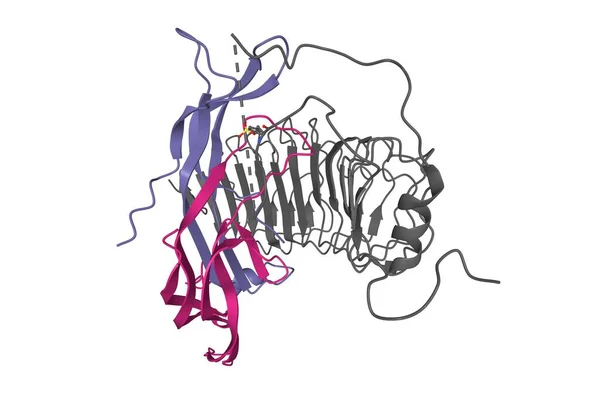
Structure Of Follicle-stimulating Hormone (color) In Complex With The Entire Ectodomain Of Its Receptor (grey), 3D Gaussian Surface Model, White Background
Image, 0.75MB, 6000 × 4000 jpg

The Sense Of Smell Detects Airborne Molecules Via Olfactory Receptors In The Nasal Cavity, Sending Signals To The Brain For Perception
Image, 1.63MB, 5154 × 3971 jpg

Diagram Showing GLP-1 Receptor Pathway With Glucose, Insulin, And Gene Expression, Outline Diagram.
Vector, 6.68MB, 4000 × 4500 eps

3D Image Of Calcium Guanylate Skeletal Formula - Molecular Chemical Structure Of Flavor Enhancer 629 Isolated On White Background
Image, 1.91MB, 5000 × 3361 jpg
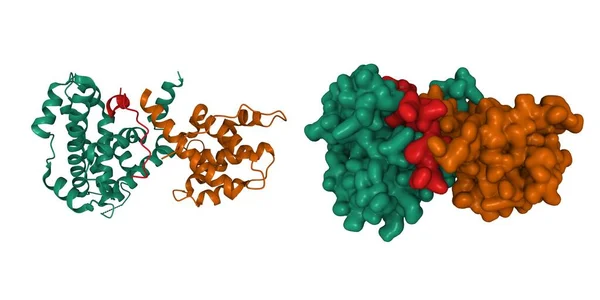
Crystal Structure Of The Retinoblastoma Tumor Suppressor Protein (AB Domain, Green And Brown) Bound To E2F Peptide (red), 3D Cartoon And Gaussian Surface Models, Chain Id Color Scheme, PDB 1o9k
Image, 3.72MB, 8000 × 4000 jpg
Structure Of Follicle-stimulating Hormone (color) In Complex With The Entire Ectodomain Of Its Receptor (grey), 3D Ribbon Model, White Background
Image, 1.39MB, 6000 × 4000 jpg
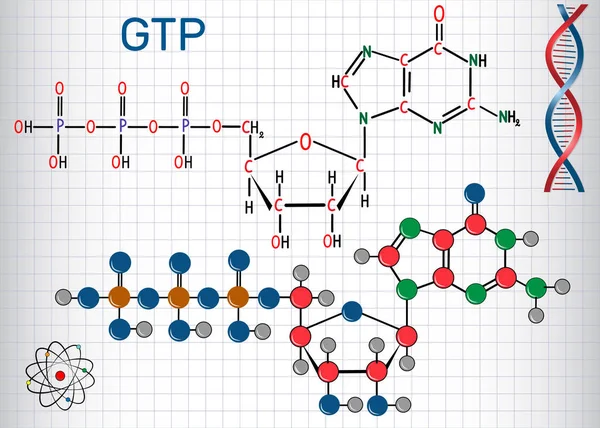
Guanosine Triphosphate (GTP) Molecule, It Is Used In Synthesis Of RNA And As A Source Of Energy For Protein Synthesis. Sheet Of Paper In A Cage. Structural Chemical Formula And Molecule Model. Vector Illustratio
Vector, 0.97MB, 5000 × 3571 eps
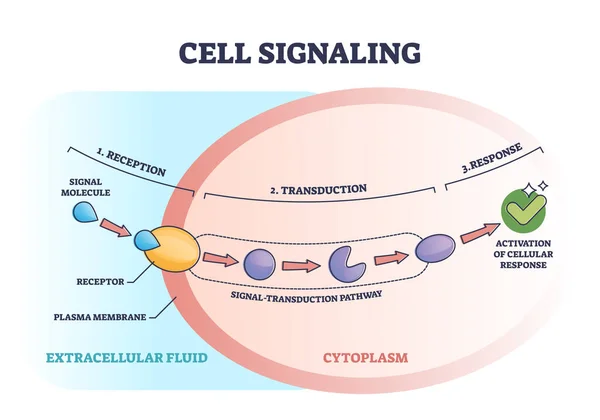
Cell Or Bio Signaling With Signal Molecule Pathway Stages Outline Diagram
Vector, 6.3MB, 5000 × 3500 eps
Activation Of The Immune Response To An Antigene (green) Through The Complex Between A T-cell Receptor (dark Blue), An MHC II-antigen (violet) And A CD4 Protein (light Blue). 3d Rendering. Illustration
Image, 6.36MB, 8000 × 6000 jpg
Previous << Page 2 >> Next