
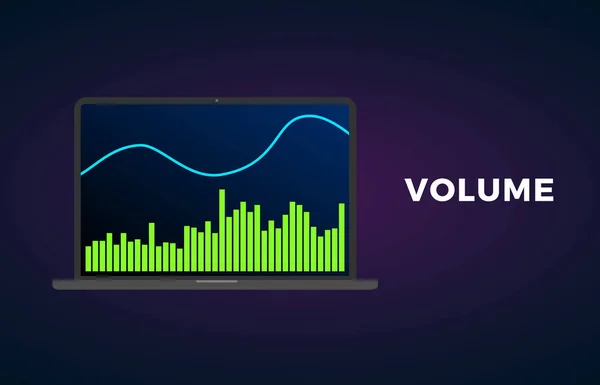
Stock image Volume Indicator Technical Analysis

Abstract Futuristic Technology Background Of Fundamental Analysis Vs Technical Analysis Stock Market Price Chart
Vector, 13.78MB, 6000 × 3375 eps
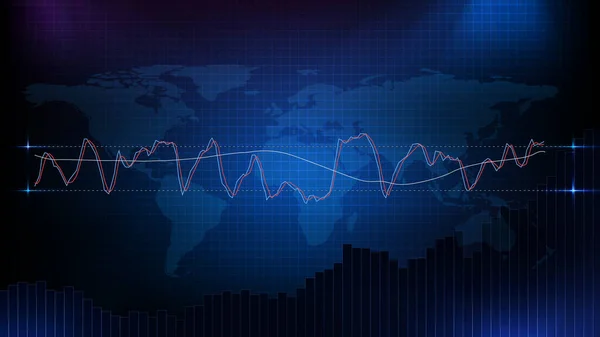
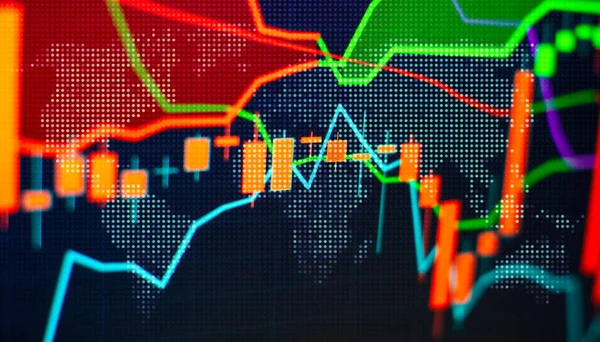
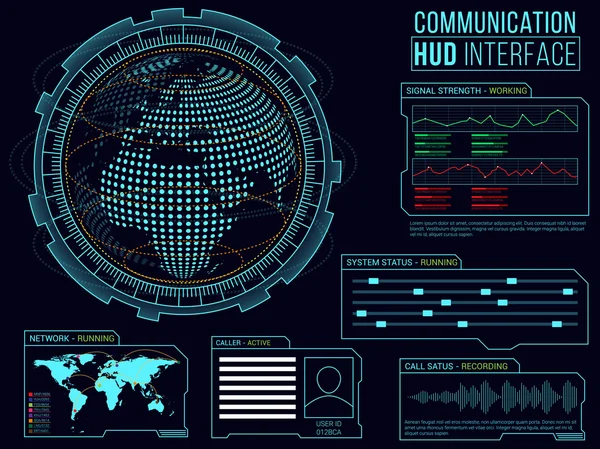
Abstract Background Of Stock Market With Macd Rsi Stochastic Strategy And World Map
Vector, 10.53MB, 6000 × 3375 eps
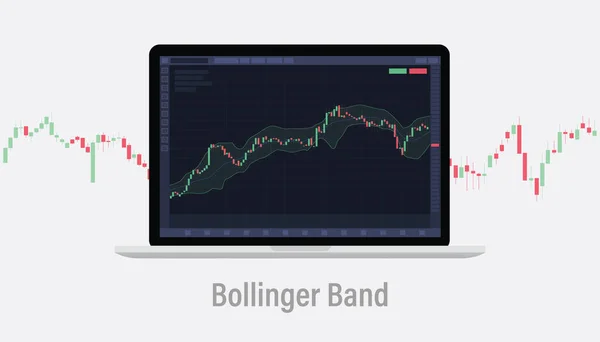
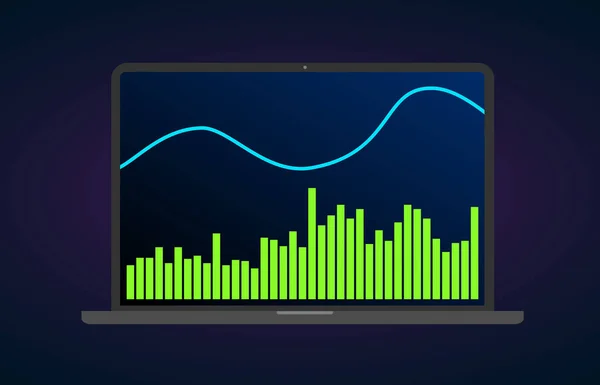
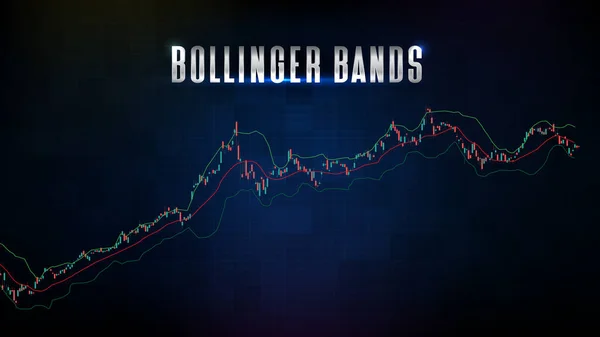
Bollinger Band Technical Analysis Indicator Concept On Laptop Screen With Candlestick With Modern Flat Style Vector Illustration
Vector, 1.11MB, 7000 × 4000 eps

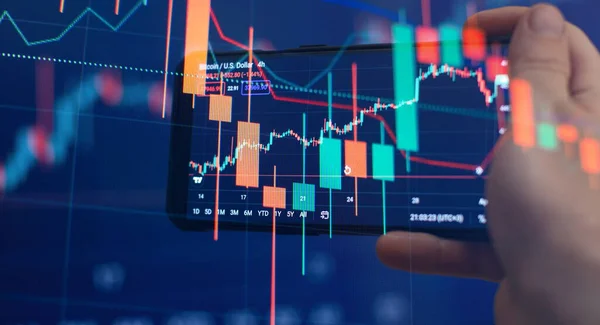
Financial Instruments With Various Type Of Indicators Including Volume Analysis For Professional Technical Analysis On The Monitor Of A Computer.
Image, 7.72MB, 5472 × 3648 jpg
Analysis For Professional Technical Analysis On The Monitor Of A Computer. Fundamental And Technical Analysis Concept.
Image, 19.44MB, 8268 × 4488 jpg
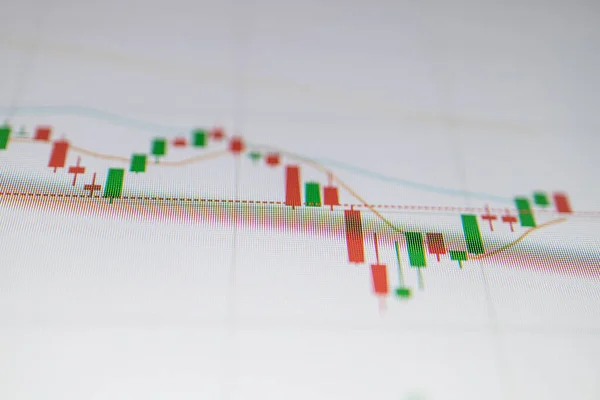
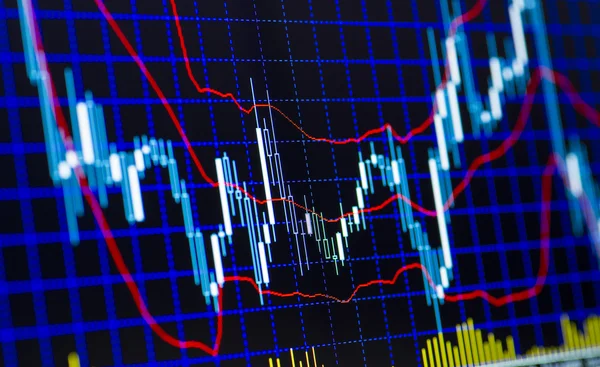
Close Up Green And Red Candle Graph On Digital Screen. Concept For Financial And Stock Graph.
Image, 22.43MB, 8192 × 5464 jpg
Volume Indicator Technical Analysis. Vector Stock And Cryptocurrency Exchange Graph, Forex Analytics And Trading Market Chart
Vector, 2.89MB, 5000 × 3214 eps

Financial Instruments With Various Type Of Indicators Including Volume Analysis For Professional Technical Analysis On The Monitor Of A Computer. Fundamental And Technical Analysis Concept.
Image, 4.61MB, 6924 × 3816 jpg
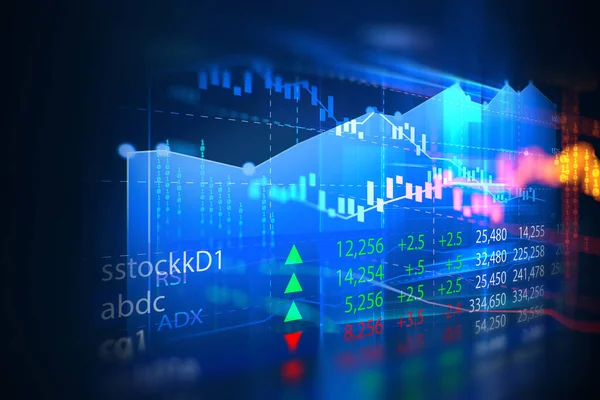
Stock Market Investment Graph On Financial Numbers Abstract Background.3d Illustratio
Image, 6.17MB, 6000 × 4000 jpg
Volume Indicator Technical Analysis. Vector Stock And Cryptocurrency Exchange Graph, Forex Analytics And Trading Market Chart
Vector, 2.89MB, 5000 × 3214 eps

Analysis Business Accounting On Info Sheets. Businessman Hand Working On Analyzing Investment Charts For Gold Market, Forex Market And Trading Market.
Image, 8.3MB, 5315 × 3543 jpg

Close Up Green And Red Candle Graph On Digital Screen. Concept For Financial And Stock Graph.
Image, 21.56MB, 8192 × 5464 jpg

Abstract Background Of Recommend Buy With Exponential Moving Averages (EMA) Stock Market And Indicator Candle Graph
Vector, 8.39MB, 6000 × 3375 eps
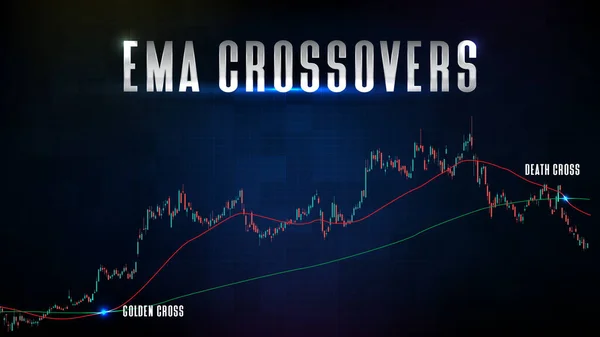
Abstract Background Of Stock Market And EMA Ema Crossover Golden Cross And Death Cross Indicator Technical Analysis Graph
Vector, 9.15MB, 6000 × 3375 eps

Stock Market Investment Graph On Financial Numbers Abstract Background.3d Illustratio
Image, 8.51MB, 6500 × 4800 jpg

Analysis For Professional Technical Analysis On The Monitor Of A Computer. Fundamental And Technical Analysis Concept.
Image, 7.21MB, 8268 × 4724 jpg

Close Up Green And Red Candle Graph On Digital Screen. Concept For Financial And Stock Graph.
Image, 8.71MB, 8192 × 5464 jpg
Indicators Including Volume Analysis For Professional Technical Analysis On The Monitor Of A Computer. Fundamental And Technical Analysis Concept.
Image, 13.78MB, 8268 × 4724 jpg

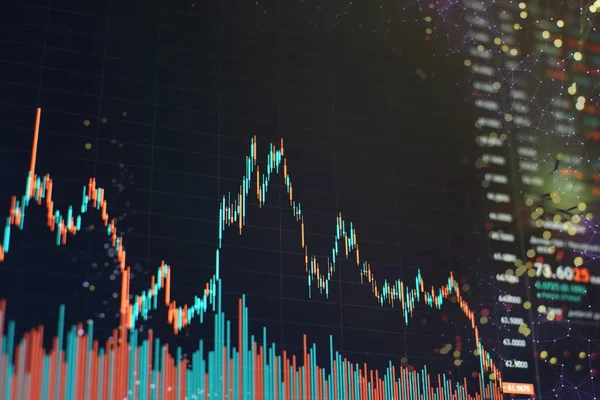
Stock Market Investment Graph On Financial Numbers Abstract Background,concept Of Economy Crash And Financial Crisis,3d Illustration
Image, 8.84MB, 5894 × 4000 jpg

Technical Trading Of Candlestick Signal Graph Fast Moving With Panic Market, Line Graph Of Green And Red Color Candle Of Selling And Buying During Business Hours For Trading Investment
Image, 3.56MB, 5819 × 3879 jpg
Analysis Business Accounting On Info Sheets. Businessman Hand Working On Analyzing Investment Charts For Gold Market, Forex Market And Trading Market.
Image, 3.5MB, 5315 × 3543 jpg

Stock Market Investment Graph On Financial Numbers Abstract Background,concept Of Economy Crash And Financial Crisis,3d Illustration
Image, 9.81MB, 6500 × 4800 jpg
Stock Market Investment Graph On Financial Numbers Abstract Background.3d Illustratio
Image, 8.17MB, 6500 × 4800 jpg
Abstract Background Of Stock Market Bollinger Bands Indicator Technical Analysis Graph
Vector, 9.01MB, 6000 × 3375 eps
Analysis Business Accounting On Info Sheets. Businessman Hand Working On Analyzing Investment Charts For Gold Market, Forex Market And Trading Market.
Image, 3.54MB, 5315 × 3543 jpg
Analysis Business Accounting On Info Sheets. Businessman Hand Working On Analyzing Investment Charts For Gold Market, Forex Market And Trading Market.
Image, 3.91MB, 5315 × 3543 jpg

Abstract Background Of Thailand Stock Market (SET50) And MACD Indicator Technical Analysis Graph
Vector, 9.19MB, 6000 × 3375 eps
Technical Trading Of Candlestick Signal Graph Fast Moving With Panic Market, Line Graph Of Green And Red Color Candle Of Selling And Buying During Business Hours For Trading Investment
Image, 3.63MB, 5684 × 3789 jpg
Analyzing Investment Statistics And Indicators On Dashboard For Trading Products.
Image, 9.69MB, 8268 × 4252 jpg

Stock Market Investment Graph On Financial Numbers Abstract Background.3d Illustratio
Image, 10.95MB, 6500 × 4800 jpg

Analysis Business Accounting On Info Sheets. Businessman Hand Working On Analyzing Investment Charts For Gold Market, Forex Market And Trading Market.
Image, 6.04MB, 5315 × 3543 jpg

Analyzing Investment Statistics And Indicators On Dashboard For Trading Products.
Image, 17.05MB, 8268 × 4252 jpg

Analysis Business Accounting On Info Sheets. Businessman Hand Working On Analyzing Investment Charts For Gold Market, Forex Market And Trading Market.
Image, 4.39MB, 5315 × 3543 jpg
Analysis Business Accounting On Info Sheets. Businessman Hand Working On Analyzing Investment Charts For Gold Market, Forex Market And Trading Market.
Image, 7.51MB, 5315 × 3543 jpg

Financial Instruments With Various Type Of Indicators Including Volume Analysis For Professional Technical Analysis On The Monitor Of A Computer.
Image, 9.93MB, 8268 × 4724 jpg
Financial Instruments With Various Type Of Indicators Including Volume Analysis For Professional Technical Analysis On The Monitor Of A Computer.
Image, 6.03MB, 8858 × 4724 jpg
Financial Instruments With Various Type Of Indicators Including Volume Analysis For Professional Technical Analysis On The Monitor Of A Computer.
Image, 5.13MB, 8268 × 4724 jpg

Analysis Business Accounting On Info Sheets. Businessman Hand Working On Analyzing Investment Charts For Gold Market, Forex Market And Trading Market.
Image, 8.65MB, 5315 × 3543 jpg
Analysis Business Accounting On Info Sheets. Businessman Hand Working On Analyzing Investment Charts For Gold Market, Forex Market And Trading Market.
Image, 5.64MB, 5315 × 3543 jpg

Analysis Business Accounting On Info Sheets. Businessman Hand Working On Analyzing Investment Charts For Gold Market, Forex Market And Trading Market.
Image, 4.57MB, 5315 × 3543 jpg
Indicators Including Volume Analysis For Professional Technical Analysis On The Monitor Of A Computer. Fundamental And Technical Analysis Concept .
Image, 2.13MB, 4724 × 3543 jpg


Analysis For Professional Technical Analysis On The Monitor Of A Computer.
Image, 7.21MB, 5472 × 3648 jpg

Financial Instruments With Various Type Of Indicators Including Volume Analysis For Professional Technical Analysis
Image, 11.28MB, 8858 × 4724 jpg

Indicators Including Volume Analysis For Professional Technical Analysis On The Monitor Of A Computer. Fundamental And Technical Analysis Concept.
Image, 2.75MB, 5315 × 3543 jpg

Page 1 >> Next