Home
Images
Vectors
Videos
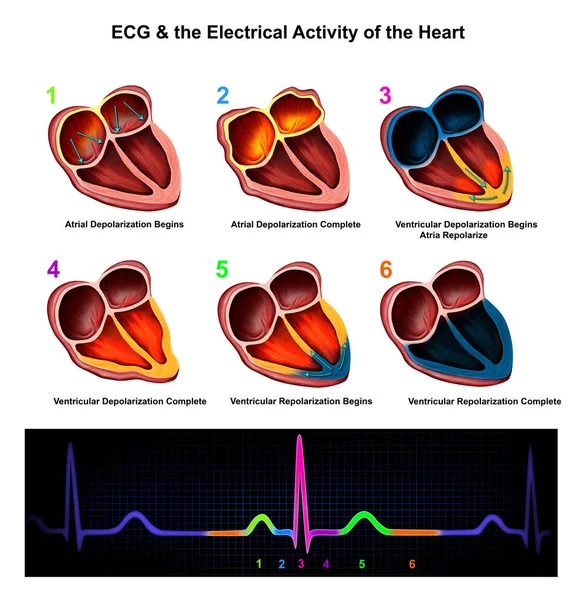
Stock image Medical illustration of ECG explained
Published:
Apr.22, 2021 13:26:59
Author:
vishmaya88@gmail.com
Views:
161
Downloads:
7
File type:
image
/
jpg
File size:
9.54 MB
Orginal size:
8031
x
7471
px
Available sizes:
S
(500 x 465)
M
(1000 x 930)
L
(2000 x 1861)
XL
(8031 x 7471)
EL0
(8031 x 7471)
Level:
beginner
Download Image
Image topics:
Health
Blood
Medicine
Medical
Cardiology
Hospital
Cholesterol
Superior
Surgery
Cardiovascular
Circulation
Artery
Cardiac
Vessels
Atrium
Ecg
Aorta
Pulmonary
Cross Section
Heart Attack
Human Heart
Blood Circulation
Electrical Activity
Heart Valve
Biomedical Illustration
Heart Anatomy
Anatomical Heart
Cardiac Rhythm
Heart Valves
Cardiac Cycle
Biology Illustrations
Left Ventricle Illustrations
Human Vein Illustrations
Color Image Illustrations
Human Artery Illustrations
Human Internal Organ Illustrations
White Background Illustrations
Blood Illustrations
Anatomical Valve Illustrations
Aorta Illustrations
Heart Ventricle Illustrations
Right Ventricle Illustrations
Blood Flow Illustrations
Human Heart Illustrations
Blood High Pressure
Anatomy Heart Attack
Blood Flow Heart
Chambers Heart
Right Artery
Ecg Explained
Similar stock images
Medical Illustration Of ECG & The Electrical Activity Of The Heart
8031 × 8410
In Acute High Lateral Myocardial Infarction, There Is Indicative ST Segment Elevation In Leads I And AVL, And Corresponding ST Segment Depression In Leads II, III And AVF.
10000 × 5739
Atrial Fibrillation Vector Illustration
8740 × 5669
Electric Conducting System Of The Heart
5800 × 4200
The Coronary Angiography Showed Complete Occlusion Of The Left Main Artery, TIMI 0 And No Stenosis In The Right Coronary Artery With TIMI 3, And A Lateral Circulation To Left Coronary Artery.
10000 × 6859
Female, 27 Years Old, Clinically Diagnosed As Uremia For 5 Years, Received Dialysis Treatment.Chest Lead QRS Wave Showed Low Voltage.
8000 × 10165
Female, 24 Years Old, Healthy. Outpatient Physical Examination ECG Showed Sinus Rhythm, Normal ECG. Note That T-wave Inversion In Lead V1 Is A Normal ECG Phenomenon.
10000 × 11505
Atrial Depolarization Forms A P Wave, Ventricular Depolarization Forms A QRS Wave, And Ventricular Repolarization Forms A T Wave, Which Constitutes A Common Waveform Of The Electrocardiogram.
10000 × 9917