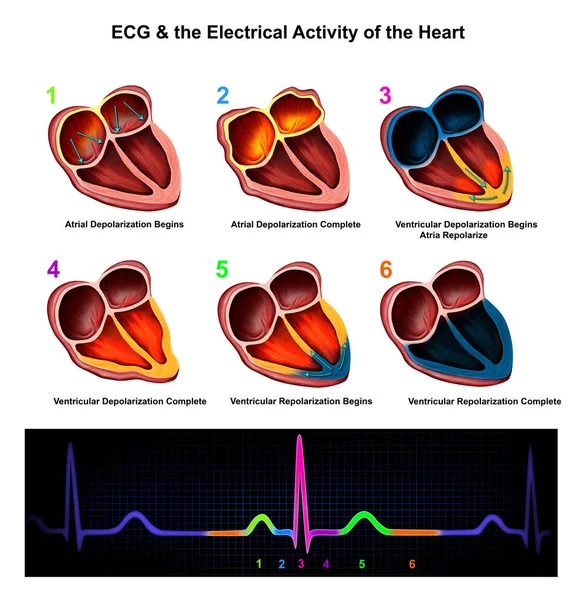
Stock image Atrial depolarization forms a P wave, ventricular depolarization forms a QRS wave, and ventricular repolarization forms a T wave, which constitutes a common waveform of the electrocardiogram.

Published: Mar.29, 2023 08:19:47
Author: asia11m
Views: 15
Downloads: 1
File type: image / jpg
File size: 9.59 MB
Orginal size: 10000 x 9917 px
Available sizes:
Level: beginner