photo free
Home Images Vectors Videos

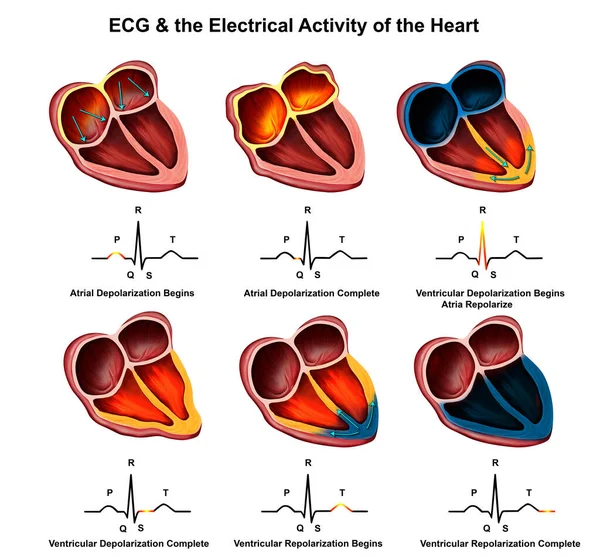
Stock image Medical illustration of ECG & the Electrical Activity of the Heart
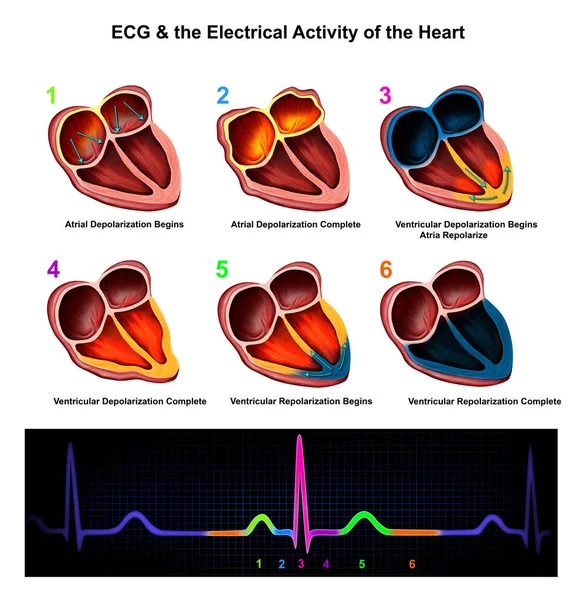
Stock image  Medical illustration of  ECG & the Electrical Activity of the Heart
Published: Apr.22, 2021 13:26:59
Author: vishmaya88@gmail.com
Views: 63
Downloads: 4
File type: image / jpg
File size: 12.13 MB
Orginal size: 8031 x 8410 px
Available sizes:
S
(477 x 500)
M
(955 x 1000)
L
(1910 x 2000)
XL
(8031 x 8410)
EL0
(8031 x 8410)
Level: beginner
Download Image
Image topics:

Similar stock images

stock image  Medical illustration of  ECG explained

Medical Illustration Of ECG Explained

8031 × 7471
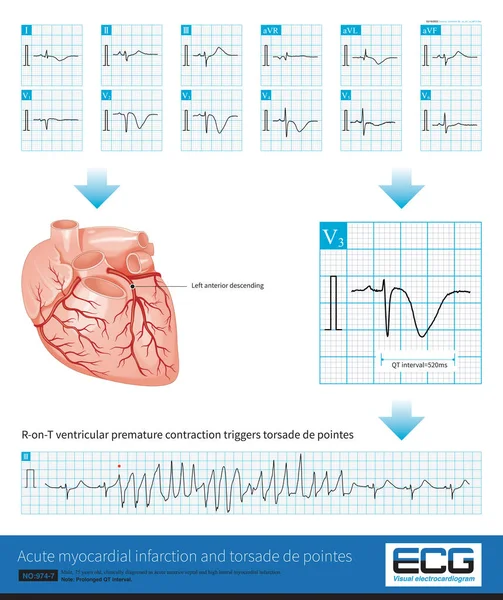
stock image Male, 75 years old, clinically diagnosed as acute anterior septal and high lateral myocardial infarction.The culprit vessel was located in the LAD proximal segment.Prolonged QT interval with TDP.

Male, 75 Years Old, Clinically Diagnosed As Acute Anterior Septal And High Lateral Myocardial Infarction.The Culprit Vessel Was Located In The LAD Proximal Segment.Prolonged QT Interval With TDP.

10000 × 11911
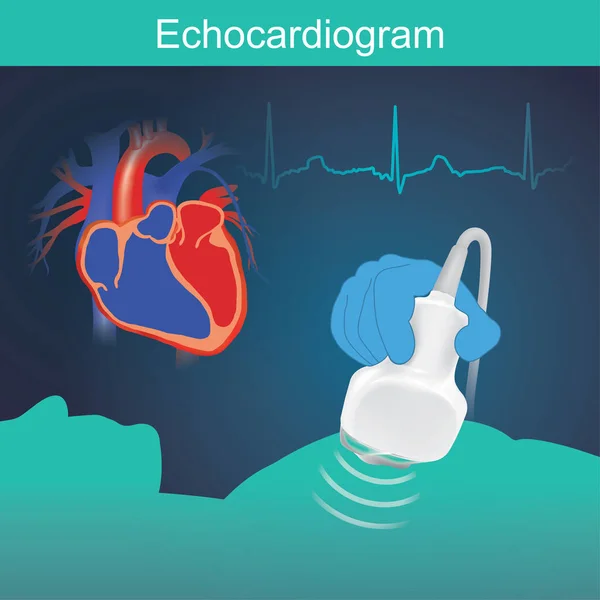
stock vector Heart examination with high frequency sound waves Very useful in evaluating heart function, Including other symptoms.

Heart Examination With High Frequency Sound Waves Very Useful In Evaluating Heart Function, Including Other Symptoms.

7875 × 7875
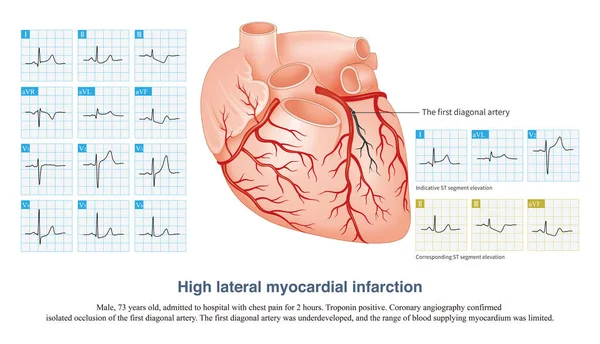
stock image In acute high lateral myocardial infarction, there is indicative ST segment elevation in leads I and aVL, and corresponding ST segment depression in leads II, III and aVF.

In Acute High Lateral Myocardial Infarction, There Is Indicative ST Segment Elevation In Leads I And AVL, And Corresponding ST Segment Depression In Leads II, III And AVF.

10000 × 5739
stock image Atrial depolarization forms a P wave, ventricular depolarization forms a QRS wave, and ventricular repolarization forms a T wave, which constitutes a common waveform of the electrocardiogram.

Atrial Depolarization Forms A P Wave, Ventricular Depolarization Forms A QRS Wave, And Ventricular Repolarization Forms A T Wave, Which Constitutes A Common Waveform Of The Electrocardiogram.

10000 × 9917
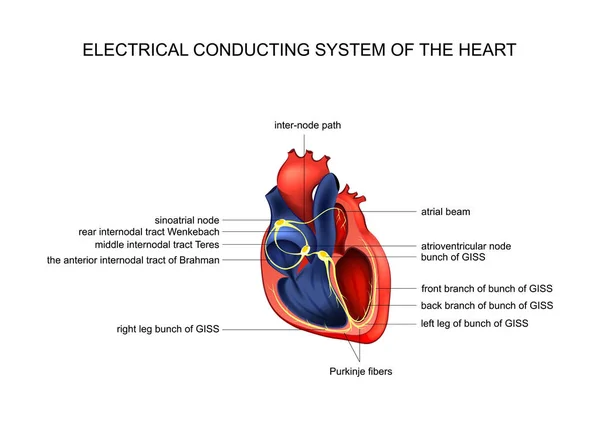
stock vector electric conducting system of the heart

Electric Conducting System Of The Heart

5800 × 4200
stock image Coronary artery spasm causes transmural myocardial ischemia, and ST segment elevation in ECG has localization characteristics. Criminal vessels can be derived from ST segment elevation leads in ECG.

Coronary Artery Spasm Causes Transmural Myocardial Ischemia, And ST Segment Elevation In ECG Has Localization Characteristics. Criminal Vessels Can Be Derived From ST Segment Elevation Leads In ECG.

10000 × 7684
stock vector atrial fibrillation vector illustration

Atrial Fibrillation Vector Illustration

8740 × 5669