Home
Images
Vectors
Videos
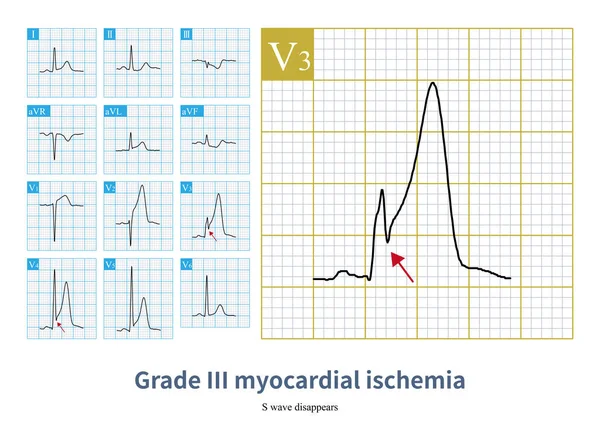
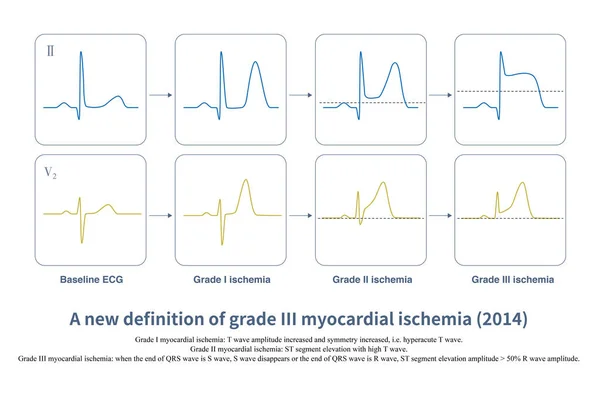
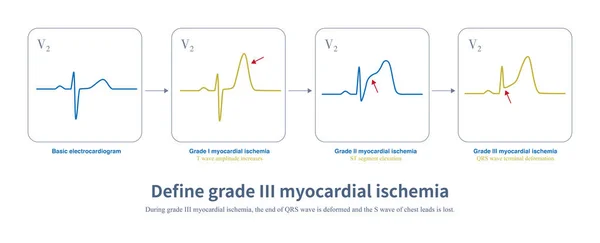
Stock image In acute myocardial ischemia, the amplitude of T wave is increased first, and then the ST segment is elevated. When the end of QRS wave is deformed, there is a lack of collateral circulation.
Published:
May.20, 2022 10:38:45
Author:
asia11m
Views:
14
Downloads:
2
File type:
image
/
jpg
File size:
1.32 MB
Orginal size:
10108
x
4093
px
Available sizes:
S
(500 x 202)
M
(1000 x 405)
L
(2000 x 810)
XL
(10108 x 4093)
EL0
(10108 x 4093)
Level:
beginner
Download Image
Image topics:
White
Graphic
Illustration
Paper
Isolated
Human
Health
Healthy
Medicine
Medical
Care
Line
Wave
Structure
Cardiology
Heart
Hospital
Monitor
Pulse
Disease
Education
Science
Death
Organ
Analysis
Graph
Rhythm
Heartbeat
Artery
Cardiogram
Cardiac
Ekg
Electrocardiogram
Ecg
Chest Pain
Myocardial Infarction
Coronary Heart Disease
Coronary Artery
Left Ventricle
Sudden Death
Myocardial Ischemia
Limb Leads
Acute Coronary Syndrome
St Segment
Ecg Education
Qrs Wave
T Wave Inversion
Ischemic Chest Pain
Similar stock images
Male, 58 Years Old, Admitted With Chest Pain For 30 Minutes. ECG Showed Hyperacute T Wave, Acute Myocardial Ischemia Involving High Lateral Wall And Anterior Wall. The Disappearance Of S Wave In Leads V3 And V4 Was Grade III Myocardial Ischemia.
10000 × 7384
QRS Wave Deformation Of Grade III Myocardial Ischemia Is Only Suitable For The First Stage Of Myocardial Ischemia (before Reperfusion), And The Disappearance Of S Wave Is Only Suitable For V1-v3 Leads
9000 × 6516
The Pathological Process Of Acute Myocardial Ischemia Is Different Under Different Physiological Conditions. Doctors Can Understand The Clinical Course Of Patients According To ECG.
10000 × 8663
Changes Such As Left Atrial Enlargement, Increased Pressure In The Left Atrium, Fibrosis Or Necrosis Of The Left Atrial Myocardium Can Lead To Left Atrial Abnormalities On The ECG.
10000 × 14201
Different Degrees Of Myocardial Ischemia Not Only Affect ST Segment And T Wave, But Also Affect The End Of QRS Wave, Resulting In The Deformation Of The End Of QRS Wave.
10000 × 6626
The Epicardial Electrogram Of Acute Myocardial Ischemia Was Recorded By Ligating The Left Anterior Descending Branch Of The Pig. Note T Wave Inversion During Reperfusion.
8784 × 7281
In AMI, If The Amplitude Of ST Segment Elevation Is Less Than 1mm, It Is Called Slight ST Segment Elevation Myocardial Infarction, Which Is Easily Misdiagnosed As Early Repolarization
7000 × 9341
Male, 53 Years Old, Chest Pain For 3 Months. The Holter Captured The Onset Of Myocardial Ischemia, Which Was Characterized By The Towering T Wave And The Deformation Of The End Of QRS Wave.
6169 × 9468