Home
Images
Vectors
Videos
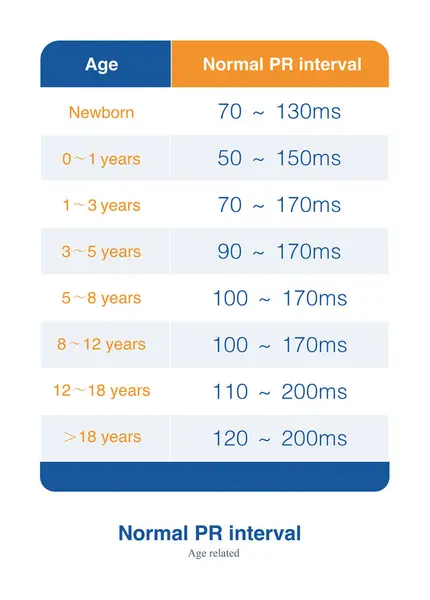
Stock image The PR interval is age-related, and the PR interval should be assessed for abnormalities based on the age of the person being examined.
Published:
May.26, 2024 12:21:54
Author:
asia11m
Views:
1
Downloads:
0
File type:
image
/
jpg
File size:
10.01 MB
Orginal size:
9000
x
12550
px
Available sizes:
S
(359 x 500)
M
(717 x 1000)
L
(1434 x 2000)
XL
(9000 x 12550)
EL0
(9000 x 12550)
Level:
beginner
Download Image
Image topics:
Human
Health
Medicine
Medical
Wave
Cardiology
Heart
Disease
Education
Graph
Beat
Rhythm
Diagnosis
Heartbeat
Anatomy
Electrode
Nursing
Cardiac
Ekg
Electrocardiogram
Atrium
Ecg
Pulsation
Ventricle
Heart Disease
Action Potential
Conduction System
ECG Monitoring
Cardiac Anatomy
Atrioventricular Node
Sinus Node
Cardiovascular Medicine
St Segment
Ecg Education
Qrs Wave
U Wave
Purkinje Fiber
His Bundle
Electrocardiogram Theory
Electrocardiogram Education
Bundle Branch
Refractory Period
Descending Conduction
Physiological Phenomenon
Atrioventricular Delay
Forward Conduction
Atrioventricular Junction Area
Similar stock images
The PR Interval Of An Ecg Includes The Time During Which Supraventricular Impulses Are Transmitted Through The Atrioventricular Node, His Bundle, Bundle Branches, And Terminal Purkinje Fibers.
10000 × 8014
Ventricular And Junctional Premature Contractions Can Activate The Ventricle Again Through The Reentry Mechanism To Form The Complex Arrhythmia Of Repetitive Beats.
10000 × 11842
Children Of Different Age Groups Have Different Normal Heart Rate Ranges. Note That Different Studies, Guidelines, Or Textbooks Provide Different Ranges Of Normal Heart Rates For Children.
10000 × 12828
When The Frontal Axis Is + 19 , The Maximum QRS Depolarization Potential Is Closest To The Axis Of Lead , So The R-wave Amplitude Of Lead Is The Highest.
10000 × 6302
2G-Regel, Geimpft Und Genesen, Translation 2G Rule, Vaccinated And Recovered, Symbolic Illustration, Green Against A White Background
8334 × 6250
When The Frontal Axis Is + 12 , The Maximum QRS Depolarization Potential Is Closest To The Axis Of Lead , So The R-wave Amplitude Of Lead , Is The Highest.
10000 × 5601
When The Frontal Axis Is -3 , The Maximum QRS Depolarization Potential Is Closest To The Axis Of Lead , So The R-wave Amplitude Of Lead Is The Highest.
10000 × 6302