photo free
Home Images Vectors Videos

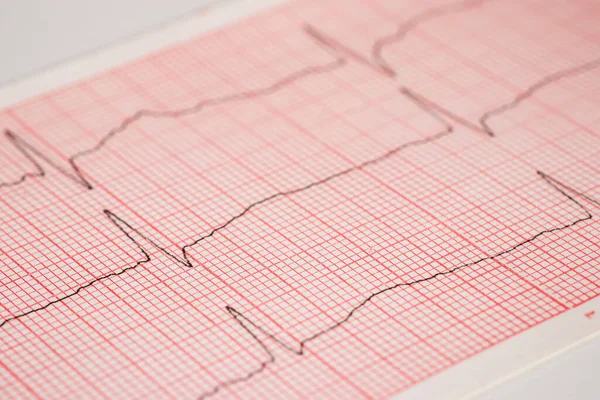
Stock image Electrocardiogram Education

stock image Bidirectional ventricular tachycardia is a kind of malignant arrhythmia. The polarity of QRS main wave alternates from beat to beat, and it is easy to degenerate into ventricular fibrillation.

Bidirectional Ventricular Tachycardia Is A Kind Of Malignant Arrhythmia. The Polarity Of QRS Main Wave Alternates From Beat To Beat, And It Is Easy To Degenerate Into Ventricular Fibrillation.

Image, 10.66MB, 10000 × 4450 jpg
stock image The illustration shows the two patterns of ventricular tachycardia episodes.The green circle represents sinus rhythm. Picture A shows paroxysmal episodes of ventricular tachycardia, and picture B shows short bursts.

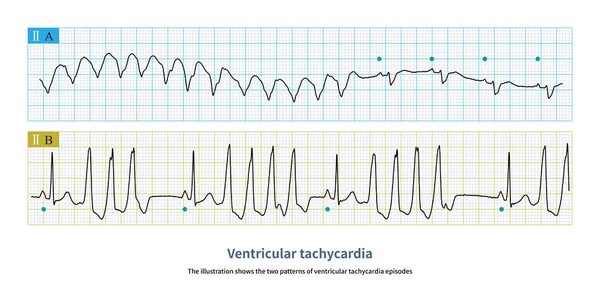
The Illustration Shows The Two Patterns Of Ventricular Tachycardia Episodes.The Green Circle Represents Sinus Rhythm. Picture A Shows Paroxysmal Episodes Of Ventricular Tachycardia, And Picture B Shows Short Bursts.

Image, 10.72MB, 10000 × 5059 jpg
stock image The left main coronary artery can be divided into the left anterior descending artery and the left circumflex artery, and sometimes the intermediate branch artery.

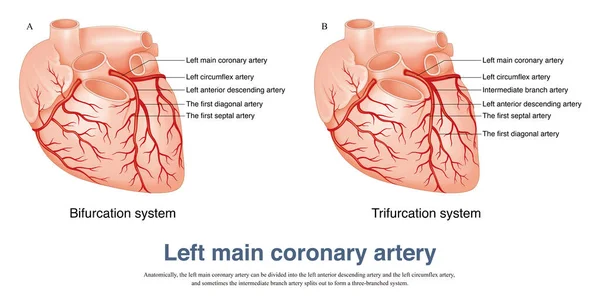
The Left Main Coronary Artery Can Be Divided Into The Left Anterior Descending Artery And The Left Circumflex Artery, And Sometimes The Intermediate Branch Artery.

Image, 7.94MB, 10000 × 5094 jpg
stock image The PR interval is age-related, and the PR interval should be assessed for abnormalities based on the age of the person being examined.

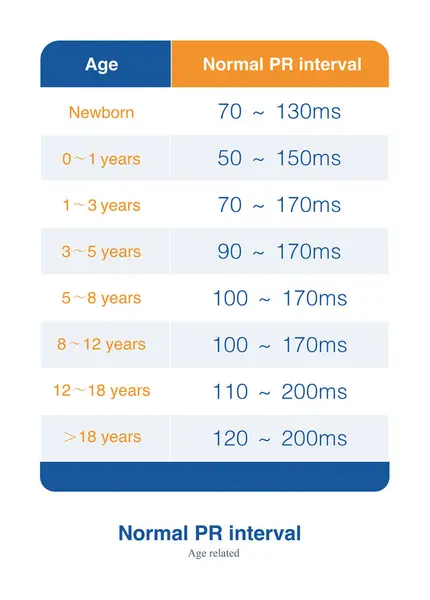
The PR Interval Is Age-related, And The PR Interval Should Be Assessed For Abnormalities Based On The Age Of The Person Being Examined.

Image, 10.01MB, 9000 × 12550 jpg
stock image The atrioventricular junction area has bidirectional conduction ability, and the impulse can be conducted from the atrium to the ventricle or from the ventricle to the atrium.

The Atrioventricular Junction Area Has Bidirectional Conduction Ability, And The Impulse Can Be Conducted From The Atrium To The Ventricle Or From The Ventricle To The Atrium.

Image, 10.39MB, 9000 × 12631 jpg
stock image The effective refractory period of the ventricular muscle is equivalent to the time from the onset of QRS to the peak of the T wave on the ECG.

The Effective Refractory Period Of The Ventricular Muscle Is Equivalent To The Time From The Onset Of QRS To The Peak Of The T Wave On The ECG.

Image, 9.8MB, 10000 × 10568 jpg
stock image The presence of atrioventricular dissociation in wide-complex tachycardia is highly suggestive of ventricular tachycardia.

The Presence Of Atrioventricular Dissociation In Wide-complex Tachycardia Is Highly Suggestive Of Ventricular Tachycardia.

Image, 11.09MB, 10000 × 5896 jpg
stock image When the rhythm of the atria originates in the lower part of the atria, the whole atria are excited from inferior to superior, producing negative P waves in the inferior leads.

When The Rhythm Of The Atria Originates In The Lower Part Of The Atria, The Whole Atria Are Excited From Inferior To Superior, Producing Negative P Waves In The Inferior Leads.

Image, 11.92MB, 10000 × 8280 jpg
stock image In acute left main occlusion, the left ventricular myocardium is massively ischemic and necrotic, the excitatory potential of the left ventricle is weakened, and the axis may deviate to the right .

In Acute Left Main Occlusion, The Left Ventricular Myocardium Is Massively Ischemic And Necrotic, The Excitatory Potential Of The Left Ventricle Is Weakened, And The Axis May Deviate To The Right .

Image, 12.47MB, 10000 × 6364 jpg
stock image The PR interval of an ecg includes the time during which supraventricular impulses are transmitted through the atrioventricular node, His bundle, bundle branches, and terminal Purkinje fibers.

The PR Interval Of An Ecg Includes The Time During Which Supraventricular Impulses Are Transmitted Through The Atrioventricular Node, His Bundle, Bundle Branches, And Terminal Purkinje Fibers.

Image, 8.05MB, 10000 × 8014 jpg
stock image The atrioventricular junction area includes the lower part of the atrium, atrioventricular node, and His bundle, and is a necessary pathway for electrical impulses to travel from the atrium to the ventricle.

The Atrioventricular Junction Area Includes The Lower Part Of The Atrium, Atrioventricular Node, And His Bundle, And Is A Necessary Pathway For Electrical Impulses To Travel From The Atrium To The Ventricle.

Image, 11.61MB, 8000 × 15472 jpg
stock image When the rhythm of the atria originates in the lower part of the atria, the whole atria are excited from inferior to superior, producing negative P waves in the inferior leads.

When The Rhythm Of The Atria Originates In The Lower Part Of The Atria, The Whole Atria Are Excited From Inferior To Superior, Producing Negative P Waves In The Inferior Leads.

Image, 5.37MB, 10000 × 2931 jpg
stock image Ventricular tachycardia originating from the right ventricular outflow tract can be sustained or short-burst, and is a benign idiopathic ventricular tachycardia.

Ventricular Tachycardia Originating From The Right Ventricular Outflow Tract Can Be Sustained Or Short-burst, And Is A Benign Idiopathic Ventricular Tachycardia.

Image, 32.6MB, 10000 × 13078 jpg
stock image Impulse encounter effective refractory period will lead to conduction interruption, and encounter relative refractory period will lead to conduction delay.

Impulse Encounter Effective Refractory Period Will Lead To Conduction Interruption, And Encounter Relative Refractory Period Will Lead To Conduction Delay.

Image, 5.98MB, 10000 × 6411 jpg
stock image A 2:1 left bundle branch block is considered when complete left bundle branch block alternates with normal QRS complexes and the PR interval is fixed.

A 2:1 Left Bundle Branch Block Is Considered When Complete Left Bundle Branch Block Alternates With Normal QRS Complexes And The PR Interval Is Fixed.

Image, 5.72MB, 10000 × 3162 jpg
stock image The coronary angiography showed complete occlusion of the left main artery, TIMI 0 and no stenosis in the right coronary artery with TIMI 3, and a lateral circulation to left coronary artery.

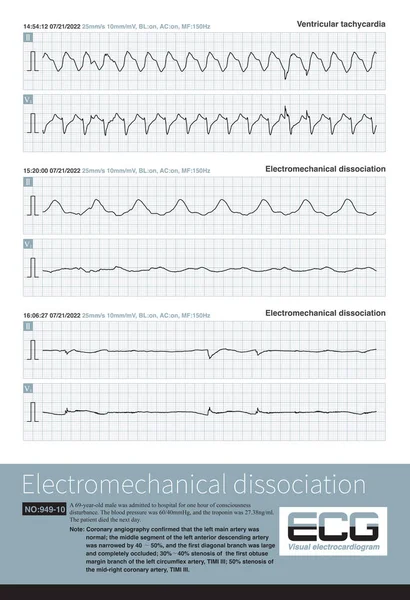
The Coronary Angiography Showed Complete Occlusion Of The Left Main Artery, TIMI 0 And No Stenosis In The Right Coronary Artery With TIMI 3, And A Lateral Circulation To Left Coronary Artery.

Image, 30.07MB, 10000 × 8377 jpg
stock image Conduction disruption occurs when the impulse encounters the effective refractory period of the downstream conduction system during conduction.

Conduction Disruption Occurs When The Impulse Encounters The Effective Refractory Period Of The Downstream Conduction System During Conduction.

Image, 10.06MB, 8000 × 13084 jpg
stock image The presence of atrioventricular dissociation in wide-complex tachycardia is highly suggestive of ventricular tachycardia.

The Presence Of Atrioventricular Dissociation In Wide-complex Tachycardia Is Highly Suggestive Of Ventricular Tachycardia.

Image, 14.3MB, 10000 × 6909 jpg
stock image Conduction delay occurs when the impulse encounters a relative refractory period downstream of the conduction system.

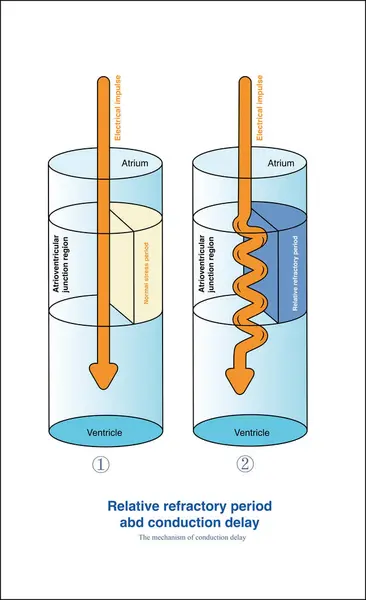
Conduction Delay Occurs When The Impulse Encounters A Relative Refractory Period Downstream Of The Conduction System.

Image, 12.48MB, 9000 × 14720 jpg
stock image Accelerated idiojunctional rhythm is commonly seen in digitalis poisoning, myocarditis, and acute myocardial infarction, and is a benign arrhythmia. The prognosis depends on the severity of the primary disease.

Accelerated Idiojunctional Rhythm Is Commonly Seen In Digitalis Poisoning, Myocarditis, And Acute Myocardial Infarction, And Is A Benign Arrhythmia. The Prognosis Depends On The Severity Of The Primary Disease.

Image, 30.38MB, 10000 × 8716 jpg
stock image heart rhythm ekg note on paper Doctors use it to analyze heart disease treatments

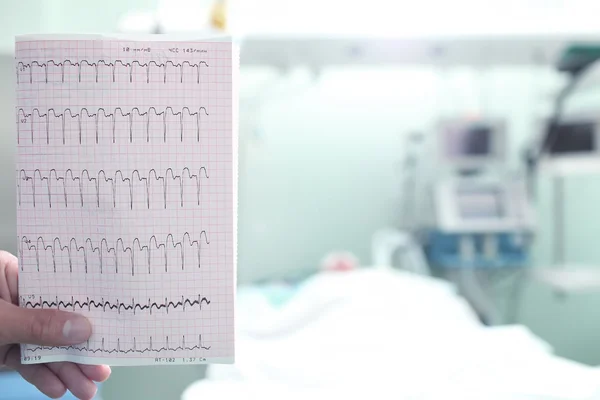
Heart Rhythm Ekg Note On Paper Doctors Use It To Analyze Heart Disease Treatments

Image, 11.14MB, 5746 × 3830 jpg
stock vector Human heart rhythm on a beautiful blue background with light sha

Human Heart Rhythm On A Beautiful Blue Background With Light Sha

Vector, 10.85MB, 5000 × 5000 eps
stock vector Human heart normal rhythm and heart anatomy

Human Heart Normal Rhythm And Heart Anatomy

Vector, 4.77MB, 5000 × 5000 eps
stock vector Medical HUD Interface layout.

Medical HUD Interface Layout.

Vector, 3.07MB, 6900 × 5174 eps
stock vector Normal heart rhythm

Normal Heart Rhythm

Vector, 4.91MB, 5000 × 5000 eps
stock image Electromechanical separation is a kind of terminal ECG. The patient's ECG has electrical signals, the ECG wave is widened with morphological abnormalities, and the ventricle has no contraction.

Electromechanical Separation Is A Kind Of Terminal ECG. The Patient's ECG Has Electrical Signals, The ECG Wave Is Widened With Morphological Abnormalities, And The Ventricle Has No Contraction.

Image, 21.68MB, 10000 × 10515 jpg
stock image Sometimes, left ventricular hypertrophy with tall T waves is easily misdiagnosed as hyperkalemia and hyperacute T waves, and ECG needs to be carefully identified in combination with clinic.

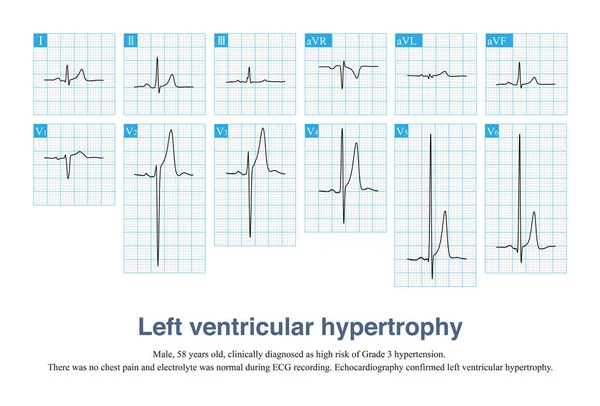
Sometimes, Left Ventricular Hypertrophy With Tall T Waves Is Easily Misdiagnosed As Hyperkalemia And Hyperacute T Waves, And ECG Needs To Be Carefully Identified In Combination With Clinic.

Image, 13.77MB, 10000 × 6782 jpg
stock image During left posterior fascicular block, the ECG showed right axis deviation. The QRS wave in leads I and aVL was rS wave, and the duration of QRS wave was less than 120 ms.

During Left Posterior Fascicular Block, The ECG Showed Right Axis Deviation. The QRS Wave In Leads I And AVL Was RS Wave, And The Duration Of QRS Wave Was Less Than 120 Ms.

Image, 30.53MB, 10000 × 11472 jpg
stock image A 36 year old man survived CPR after sudden syncope. The electrocardiogram was suggestive of Brugada syndrome type 1. Implantation of ICD therapy.

A 36 Year Old Man Survived CPR After Sudden Syncope. The Electrocardiogram Was Suggestive Of Brugada Syndrome Type 1. Implantation Of ICD Therapy.

Image, 19.26MB, 9000 × 13286 jpg
stock vector Schemes set of common electrocardiogram (ECG) abnormalities, including partial blocks and flutter

Schemes Set Of Common Electrocardiogram (ECG) Abnormalities, Including Partial Blocks And Flutter

Vector, 9.68MB, 7750 × 4367 eps
stock image Sometimes, because the QRS axis is in the upper left quadrant, the high-amplitude R wave of left ventricular hypertrophy occurs in the limb leads, and left chest leads is normal.

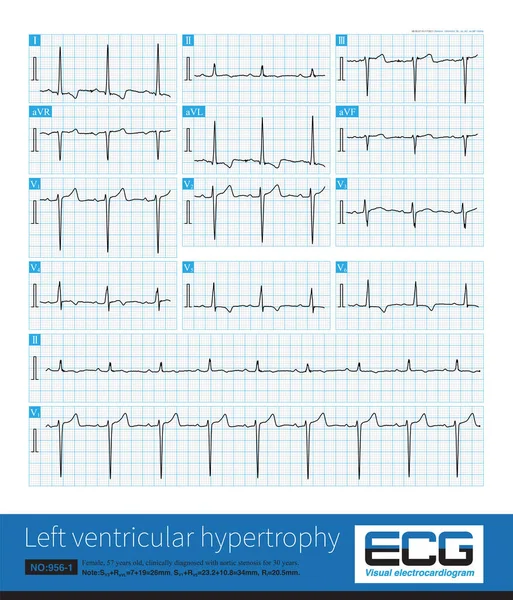
Sometimes, Because The QRS Axis Is In The Upper Left Quadrant, The High-amplitude R Wave Of Left Ventricular Hypertrophy Occurs In The Limb Leads, And Left Chest Leads Is Normal.

Image, 31.4MB, 10000 × 11694 jpg
stock image an abnormal electrocardiogram tracing (lateral wall ischemia)  and a red heart-shaped object, heart disease concept, medical background, medical education

An Abnormal Electrocardiogram Tracing (lateral Wall Ischemia) And A Red Heart-shaped Object, Heart Disease Concept, Medical Background, Medical Education

Image, 14.77MB, 6000 × 4000 jpg
stock image R wave greater than S wave is judged to be positive; R smaller than S  is judged to be negative; R equal to S amplitude is judged to be equipotential.

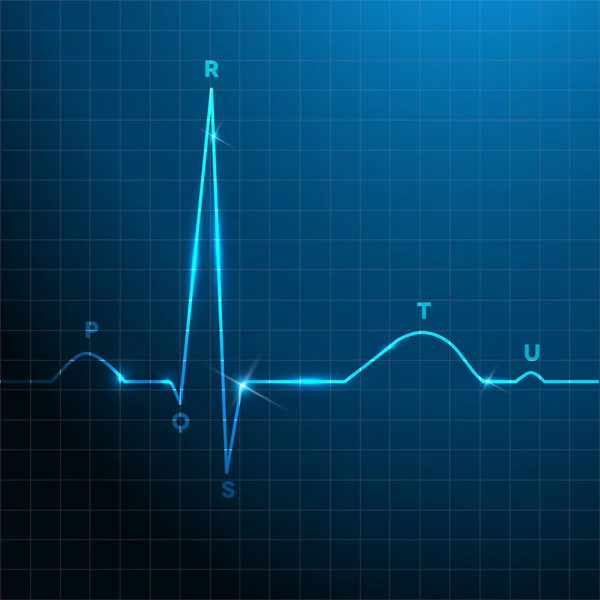
R Wave Greater Than S Wave Is Judged To Be Positive; R Smaller Than S Is Judged To Be Negative; R Equal To S Amplitude Is Judged To Be Equipotential.

Image, 7.5MB, 10000 × 5119 jpg
stock image Torsade de pointes refers to the pleomorphic ventricular tachycardia that occurs in the background of long QT interval, and the polarity of QRS wave twists around the equipotential line.

Torsade De Pointes Refers To The Pleomorphic Ventricular Tachycardia That Occurs In The Background Of Long QT Interval, And The Polarity Of QRS Wave Twists Around The Equipotential Line.

Image, 18.28MB, 10000 × 5808 jpg
stock image A patient with acute extensive anterior  myocardial infarction developed ventricular tachycardia during hospitalization and quickly experienced cardiac arrest.

A Patient With Acute Extensive Anterior Myocardial Infarction Developed Ventricular Tachycardia During Hospitalization And Quickly Experienced Cardiac Arrest.

Image, 31.98MB, 10000 × 14632 jpg
stock vector Human heart and blue background

Human Heart And Blue Background

Vector, 7.16MB, 6000 × 3890 eps
stock image Heart beats Green cardiogram

Heart Beats Green Cardiogram

Image, 1.59MB, 2780 × 1600 jpg
stock vector Human heart beat, isolated on white

Human Heart Beat, Isolated On White

Vector, 8.75MB, 5440 × 4550 eps
stock vector Medical clipboard

Medical Clipboard

Vector, 0.44MB, 2800 × 2800 eps
stock image Generally, when the sinus heart rate is below 60 beats per minute, it is called sinus bradycardia. This arrhythmia can be both physiological and often pathological.

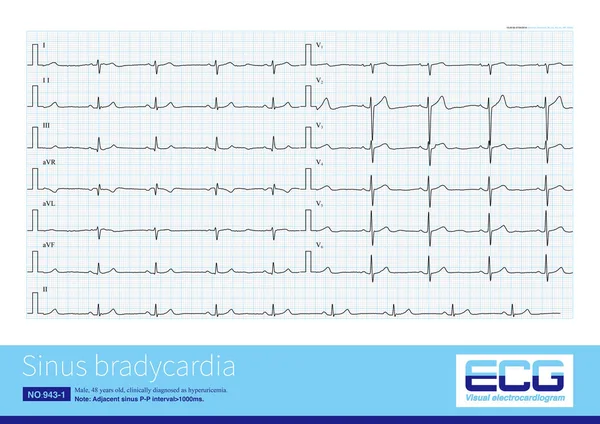
Generally, When The Sinus Heart Rate Is Below 60 Beats Per Minute, It Is Called Sinus Bradycardia. This Arrhythmia Can Be Both Physiological And Often Pathological.

Image, 20.38MB, 10000 × 7069 jpg
stock image Male, 60 years old, clinically diagnosed as acute extensive anterior wall myocardial infarction. The patient died of ventricular fibrillation after admission.

Male, 60 Years Old, Clinically Diagnosed As Acute Extensive Anterior Wall Myocardial Infarction. The Patient Died Of Ventricular Fibrillation After Admission.

Image, 10.58MB, 10000 × 6427 jpg
stock image Note that the V3 lead of this ECG shows that the amplitude of R wave is greater than the amplitude of S wave, and there is counterclockwise rotation.

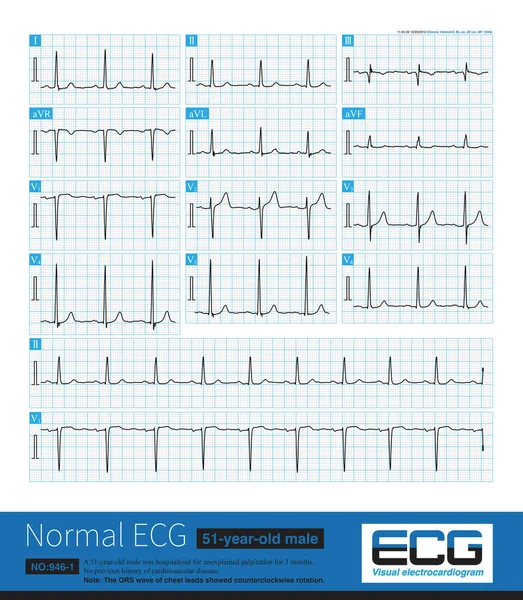
Note That The V3 Lead Of This ECG Shows That The Amplitude Of R Wave Is Greater Than The Amplitude Of S Wave, And There Is Counterclockwise Rotation.

Image, 33.74MB, 10000 × 11469 jpg
stock image ECG with a heart attack in hospital ward

ECG With A Heart Attack In Hospital Ward

Image, 4.32MB, 4500 × 3000 jpg
stock image eart beats cardiogram

Eart Beats Cardiogram

Image, 2.7MB, 4400 × 2452 jpg
stock image Male, 60 years old, clinically diagnosed as acute extensive anterior wall myocardial infarction. The patient died of ventricular fibrillation after admission.

Male, 60 Years Old, Clinically Diagnosed As Acute Extensive Anterior Wall Myocardial Infarction. The Patient Died Of Ventricular Fibrillation After Admission.

Image, 6.05MB, 10000 × 4656 jpg
stock vector Colorful human heart normal sinus rhythm, electrocardiogram record. Bright and bold design

Colorful Human Heart Normal Sinus Rhythm, Electrocardiogram Record. Bright And Bold Design

Vector, 0.73MB, 4710 × 3042 eps
stock vector Medical clipboard

Medical Clipboard

Vector, 0.45MB, 2800 × 2800 eps
stock image Stethoscope and red toy heart lying on electrocardiogram on blue background closeup

Stethoscope And Red Toy Heart Lying On Electrocardiogram On Blue Background Closeup

Image, 11.7MB, 8192 × 5464 jpg
stock image Woman doctor showing heart model to students

Woman Doctor Showing Heart Model To Students

Image, 9.6MB, 6016 × 4016 jpg
stock image watercolor heart health, and cardiogram. heart disease, heart rate. syringe treatment

Watercolor Heart Health, And Cardiogram. Heart Disease, Heart Rate. Syringe Treatment

Image, 6.35MB, 4793 × 4792 jpg
Page 1 >> Next