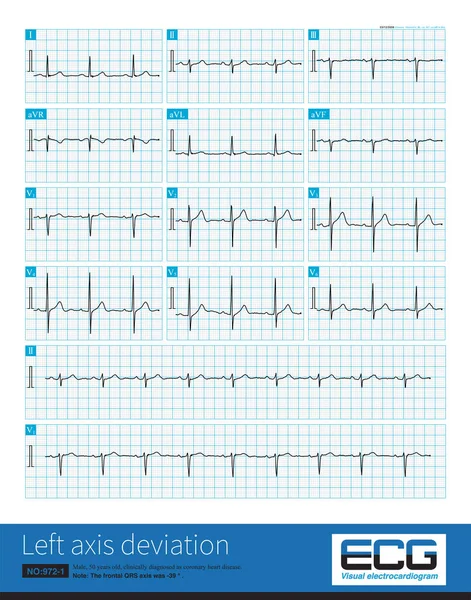
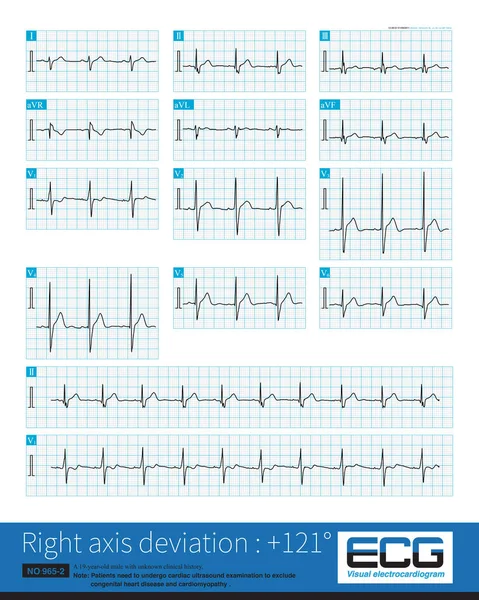
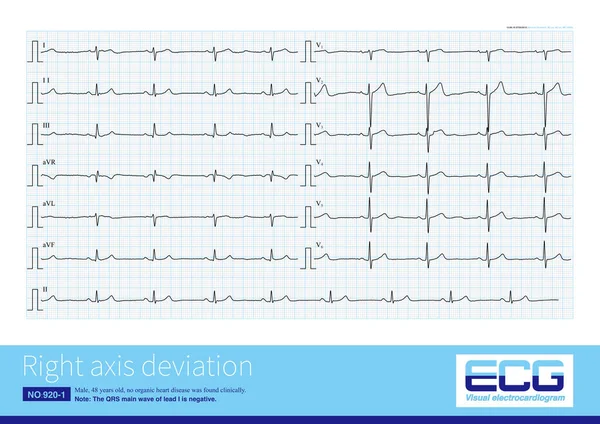
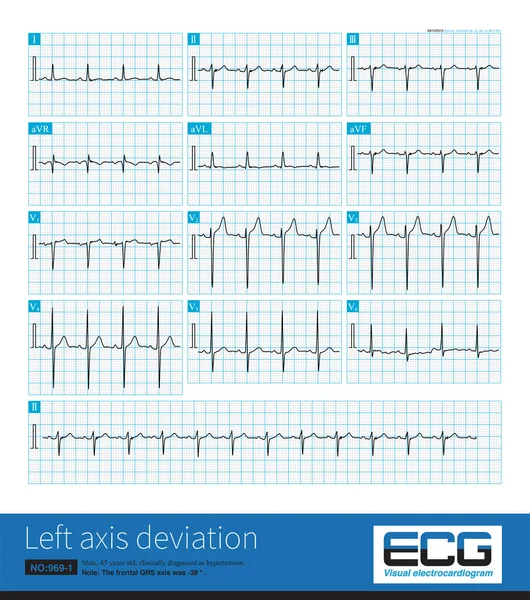
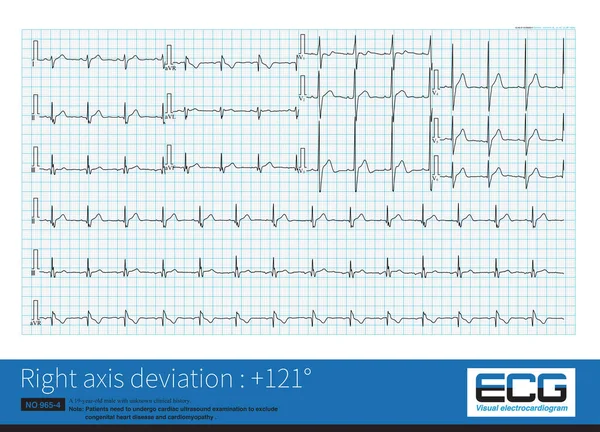
Stock image When the electrical axis deviates to the right, the maximum QRS vector is located in the lower right quadrant, which can be interpreted in combination with the QRS wave characteristics of limb leads.
Published: Oct.06, 2022 12:04:26
Author: asia11m
Views: 16
Downloads: 0
File type: image / jpg
File size: 24.3 MB
Orginal size: 10000 x 7207 px
Available sizes:
Level: beginner