
Stock image Conduction Disorder

In Complete Left Bundle Branch Block, The Conduction Of The LBB Can Be Completely Interrupted Or Can Still Be Conducted, But It Is Delayed By At Least 45ms Than The RBB.
Image, 10.8MB, 10000 × 5497 jpg
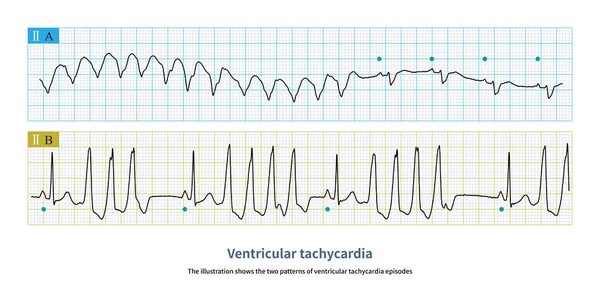
The Illustration Shows The Two Patterns Of Ventricular Tachycardia Episodes.The Green Circle Represents Sinus Rhythm. Picture A Shows Paroxysmal Episodes Of Ventricular Tachycardia, And Picture B Shows Short Bursts.
Image, 10.72MB, 10000 × 5059 jpg

During Left Posterior Fascicular Block, The ECG Showed Right Axis Deviation. The QRS Wave In Leads I And AVL Was RS Wave, And The Duration Of QRS Wave Was Less Than 120 Ms.
Image, 30.53MB, 10000 × 11472 jpg
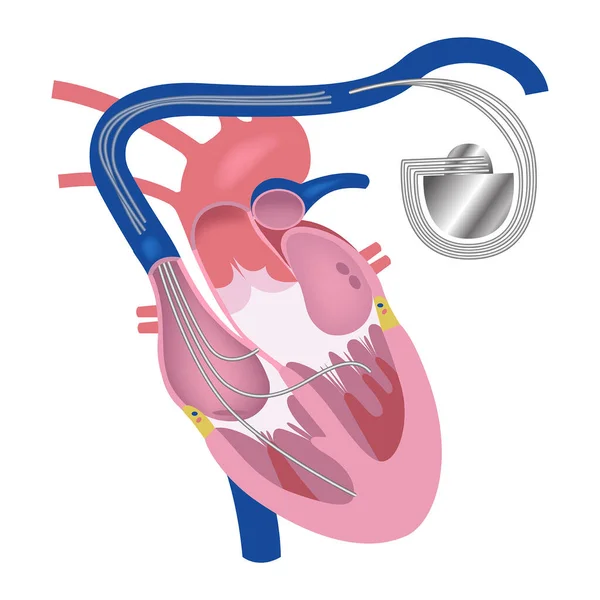
Pacemaker. Heart In Longitudinal Section. Vector Medical Illustration
Vector, 9.18MB, 2000 × 2000 eps
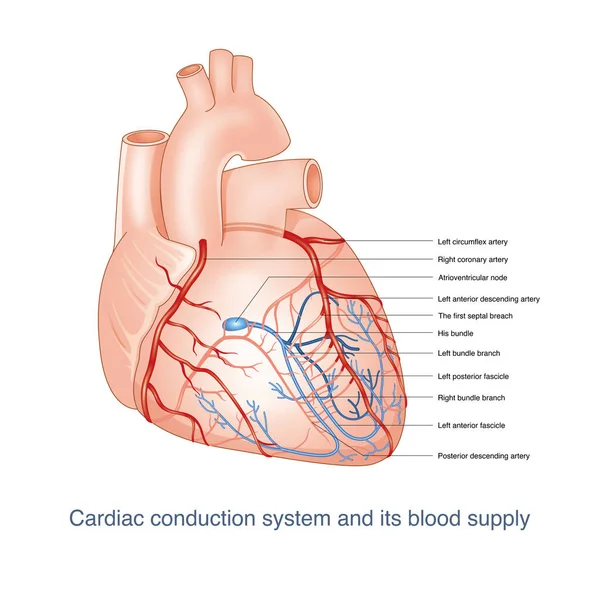
The Conduction System Of The Heart Is Supplied By The Branches Of The Coronary Artery. Once The Blood Vessels Are Blocked, It Can Cause Conduction Disorder. This Picture Is Suitable For Dark Background. This Picture Is Suitable For Light Background.
Image, 12.07MB, 10000 × 10000 jpg

Doctor In Office At Desk With Laptop During Patient Admission Scans Paper Tape With Printed Result Of ECG. Concept Photo Of Diagnosis Of Cardiac Heart Disease, Arrhythmias, Heart Rhythm Disturbances
Image, 9.06MB, 6000 × 4000 jpg

Doctor Cardiologist Examining Cardiogram Against Background Of Artificial Heart Model Closeup
Image, 13.9MB, 8192 × 5464 jpg

Diagnosis, Treatment And Prevention Of Diseases Of Heart And Cardiovascular System Concept Photo. Blue Stethoscope Is Surrounded By Tape Of ECG With Electrocardiogram Drawn On It. Diagnosis Of Disease
Image, 6.13MB, 6000 × 4000 jpg
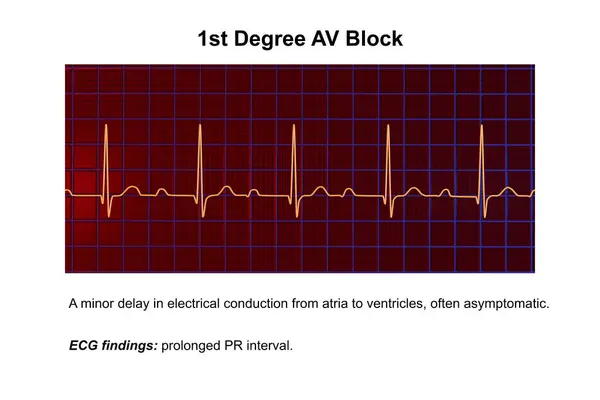
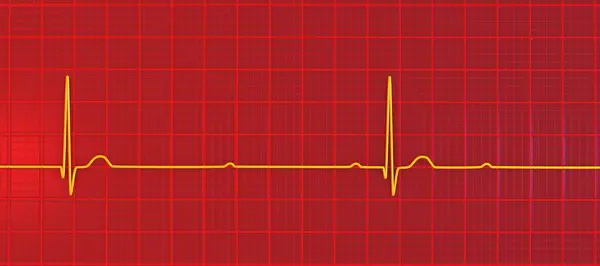
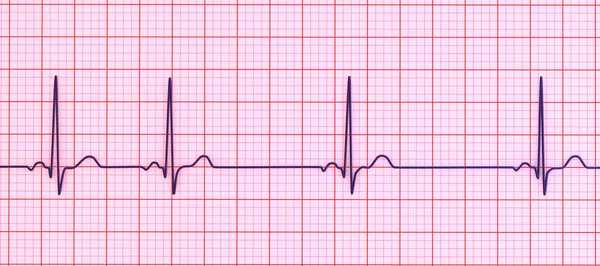
3D Illustration Of An ECG Displaying 1st Degree AV Block, A Cardiac Conduction Disorder.
Image, 10.7MB, 9000 × 6000 jpg


3D Illustration Visualizing An ECG With 2nd Degree AV Block (Wenckebach), Highlighting Abnormal Electrical Conduction In The Heart Rhythm.
Image, 0.7MB, 7000 × 2592 jpg
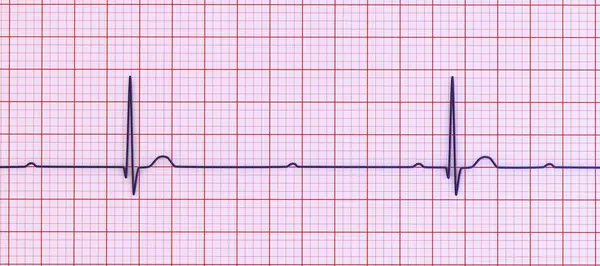
3D Illustration Visualizing An ECG With 3rd Degree AV Block, Showing Complete Dissociation Between Atrial And Ventricular Rhythms.
Image, 0.61MB, 9000 × 4000 jpg
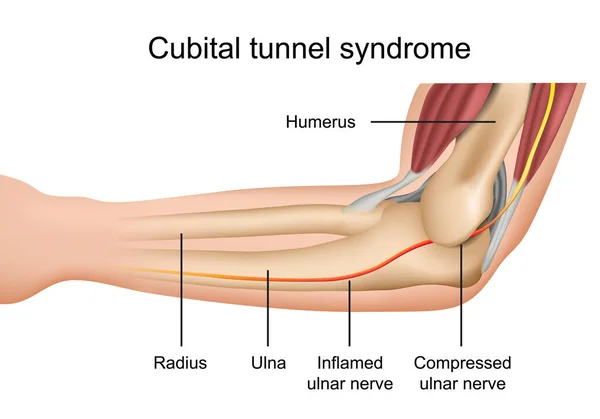
Cubital Tunnel Syndrome Medical Vector Illustration With English Description
Vector, 4.76MB, 7143 × 5000 eps

3D Illustration Visualizing An ECG With 3rd Degree AV Block, Showing Complete Dissociation Between Atrial And Ventricular Rhythms.
Image, 4.23MB, 9000 × 6000 jpg
3D Illustration Visualizing An ECG With 3rd Degree AV Block, Showing Complete Dissociation Between Atrial And Ventricular Rhythms.
Image, 0.44MB, 7000 × 3528 jpg
3D Illustration Visualizing An ECG With 3rd Degree AV Block, Showing Complete Dissociation Between Atrial And Ventricular Rhythms.
Image, 4.49MB, 9000 × 4000 jpg
3D Illustration Visualizing An ECG With 2nd Degree AV Block (Mobitz 2), Highlighting Abnormal Electrical Conduction In The Heart Rhythm.
Image, 0.77MB, 7000 × 2800 jpg

Model Of Spine With Spinal Cord With Neurological Hammer And Device For Diagnosing Skin Sensitivity And Sensitive Disorders On White Background. Photo For Illustration Of Diagnosis And Treatment Of Neurological Diseases In Neurology And Neurosurgery
Image, 4.39MB, 6000 × 4000 jpg


Myasthenia Gravis. Autoimmune Disease. Space Between Neuron And Muscle. In Myasthenia Gravis, Abnormal Antibodies Prevent Acetylcholine From Binding, Blocked Ion Channels And The Normal Communication Process Between Muscles And Nerves. Vector Poster.
Vector, 0.93MB, 5000 × 3965 eps
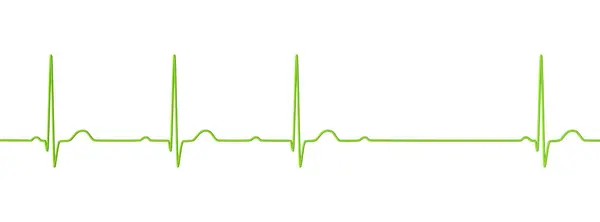
A Detailed 3D Illustration Of An Electrocardiogram ECG Displaying Sinus Arrhythmia, A Condition Characterized By Irregular Heart Rhythms Originating From The Sinus Node.
Image, 12.85MB, 9000 × 4000 jpg

A Neurologist Or Neurosurgeon Diagnoses Anatomical Model Of Spine With Spinal Cord Using Phonendoscope For Diseases Of Spinal Or Nerve Roots. Photo For Use In Neurology, Neurosurgery Or Neuroscience
Image, 6.39MB, 6000 × 4000 jpg
3D Illustration Visualizing An ECG With 3rd Degree AV Block, Showing Complete Dissociation Between Atrial And Ventricular Rhythms.
Image, 5.11MB, 9000 × 4000 jpg

3D Illustration Visualizing An ECG With 3rd Degree AV Block, Showing Complete Dissociation Between Atrial And Ventricular Rhythms.
Image, 7.45MB, 9000 × 6000 jpg
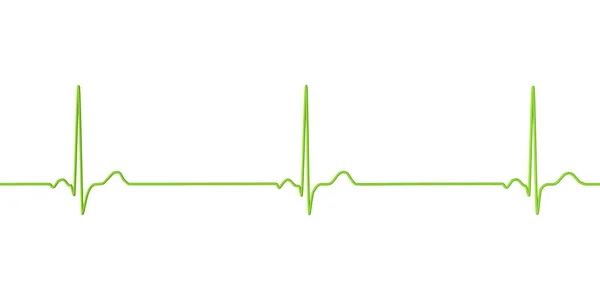
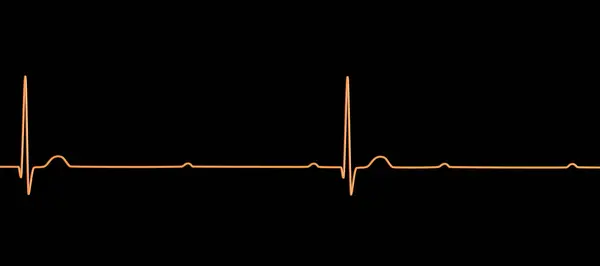
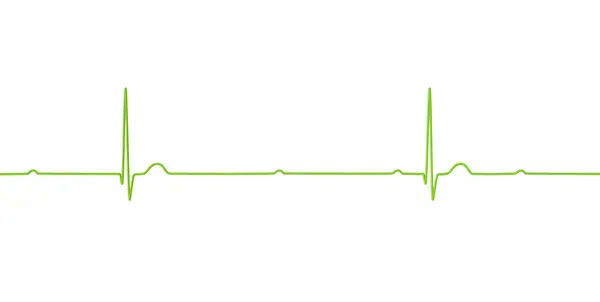
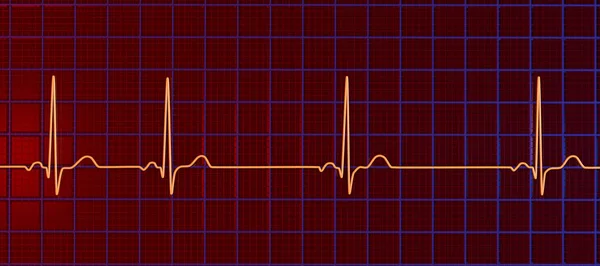
A Detailed 3D Illustration Of An Electrocardiogram Displaying Sinus Bradycardia, A Condition Characterized By A Slow Heart Rate Originating From The Sinus Node, Typically Below 60 Beats Per Minute.
Image, 0.75MB, 7000 × 3500 jpg

3D Illustration Visualizing An ECG With 3rd Degree AV Block, Showing Complete Dissociation Between Atrial And Ventricular Rhythms.
Image, 9.73MB, 9000 × 6000 jpg

3D Illustration Visualizing An ECG With 3rd Degree AV Block, Showing Complete Dissociation Between Atrial And Ventricular Rhythms.
Image, 7.26MB, 9000 × 6000 jpg
A Detailed 3D Illustration Of An Electrocardiogram ECG Displaying Sinus Arrhythmia, A Condition Characterized By Irregular Heart Rhythms Originating From The Sinus Node.
Image, 9.76MB, 9000 × 4000 jpg
3D Illustration Visualizing An ECG With 2nd Degree AV Block (Wenckebach), Highlighting Abnormal Electrical Conduction In The Heart Rhythm.
Image, 1.11MB, 9000 × 4000 jpg

3D Illustration Visualizing An ECG With 3rd Degree AV Block, Showing Complete Dissociation Between Atrial And Ventricular Rhythms.
Image, 2.59MB, 9000 × 6000 jpg

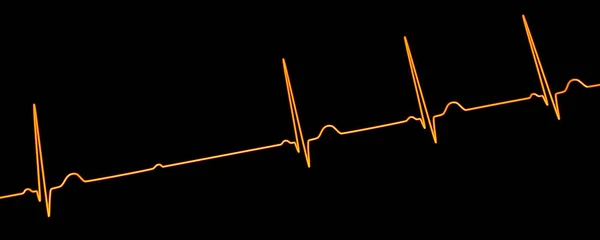
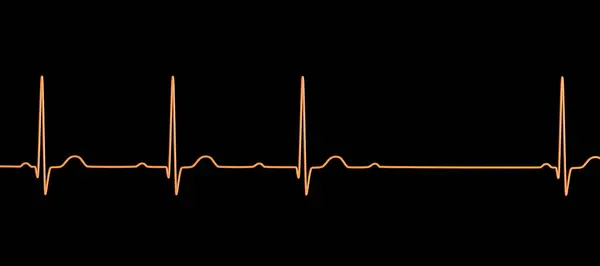
An Electrocardiogram Displaying Sinus Bradycardia, A Condition Characterized By A Slow Heart Rate Originating From The Sinus Node, Typically Below 60 Beats Per Minute, 3D Illustration.
Image, 4.47MB, 9000 × 6000 jpg

A Patient With AIMI Presents With A Sudden Widening Of The QRS Complex In The Junctional Escape Rhythm, Premature Ventricular Contractions, Resulting In Polymorphic Ventricular Tachycardia.
Image, 14.66MB, 10000 × 7554 jpg

3D Illustration Visualizing An ECG Of 2nd Degree AV Block (Wenckebach), Highlighting Abnormal Electrical Conduction In The Heart Rhythm.
Image, 10.55MB, 9000 × 6000 jpg

Page 1 >> Next