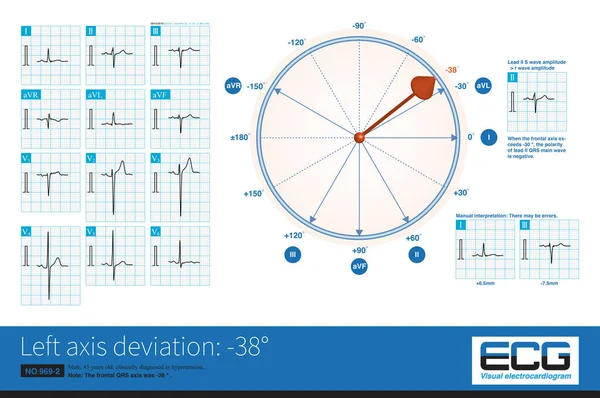
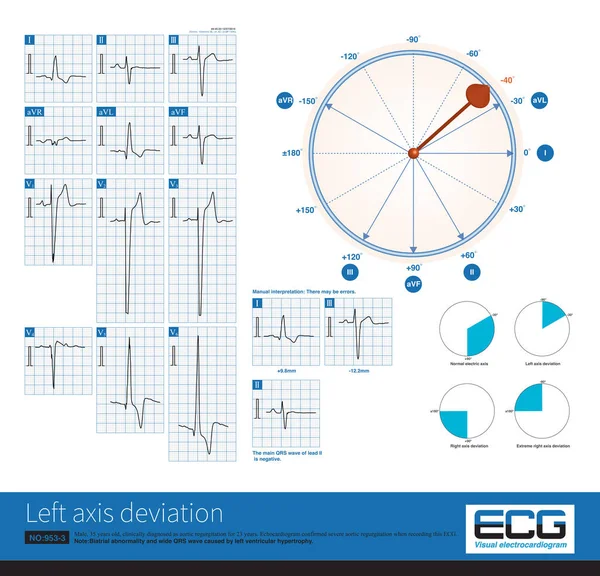
Stock image When the electrical axis of the electrocardiogram is severely left deviation, especially near the negative side of the aVF lead axis, significant S-waves appear in leads I, II, and III.

Published: Sep.26, 2023 13:44:17
Author: asia11m
Views: 2
Downloads: 0
File type: image / jpg
File size: 11.54 MB
Orginal size: 10000 x 6242 px
Available sizes:
Level: beginner