
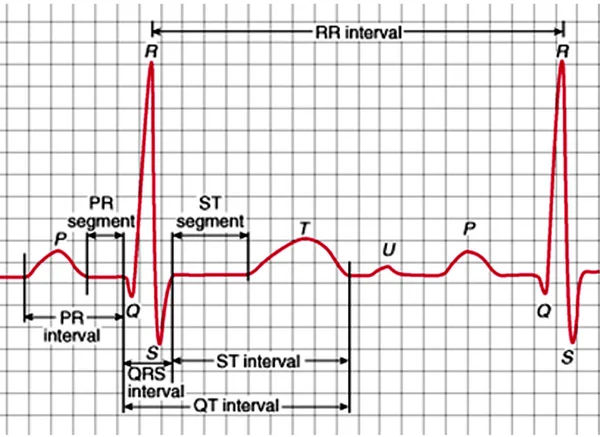
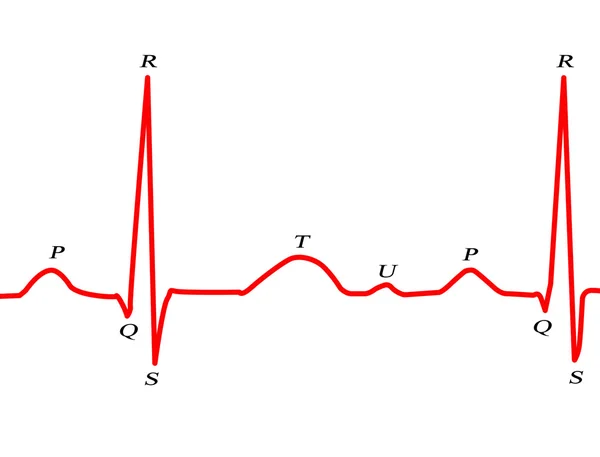
Stock image QRS Complex
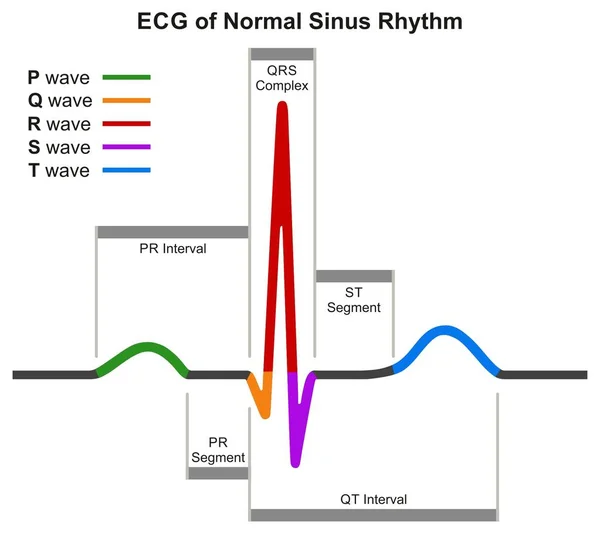
ECG Of Normal Sinus Rhythm Infographic Diagram Showing Normal Heart Beat Wave Including Intervals Segments And Complex For Medical Science Education And Health Care
Vector, 0.15MB, 2169 × 1933 eps
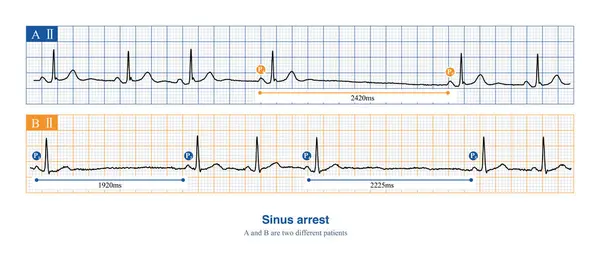
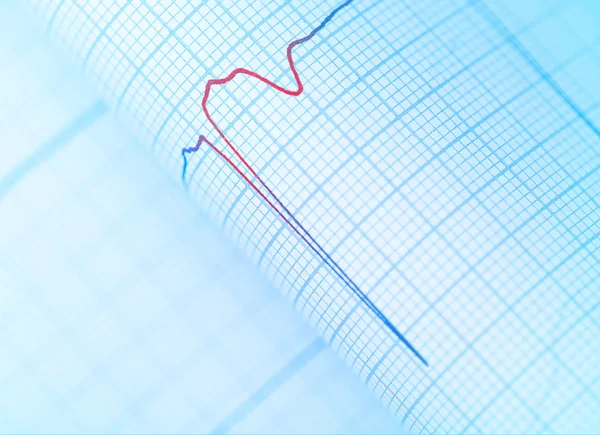
When Sinus Arrest Occurs, The Electrocardiogram Will Show A Long P-P Interval, Which Is Not Multiples Of The Basal Sinus Cycle, Including Physiological And Pathological Reasons.
Image, 8.96MB, 10000 × 4418 jpg

Cardiologist Examining Senior Patient With Holter Device In The Department Of Cardiology In The Hospital. Woman Doctor Attaches Sensors To Measure ECG And Blood Pressure. Matury Man On Clinic Couch
Image, 8.86MB, 5472 × 3648 jpg

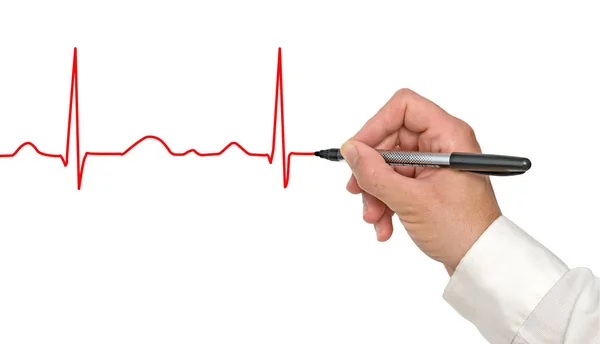
Abnormal ECG Refers To Changes In Depolarization Waves And Or Repolarization Waves, Most Of Which Are Pathologic And Few Are Physiological.
Image, 7.91MB, 10000 × 5625 jpg

Third Degree Atrioventricular Block In Young Women May Be Congenital, With The Block Located On The Atrioventricular Node Or Above Bifurcation Of The His Bundle.
Image, 9.81MB, 11538 × 7031 jpg

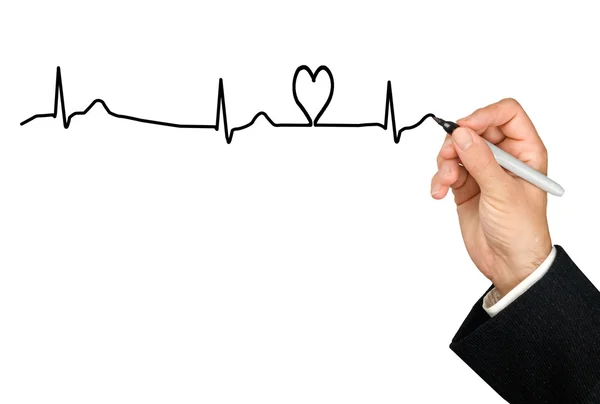
Sometimes, There May Be Slight Non-specific Changes And Normal Variations In The Electrocardiogram, Which Are Often Due To Physiological Reasons And Have No Clinical Therapeutic Significance.
Image, 13.15MB, 10000 × 11438 jpg

Abnormal ECG Refers To Changes In Depolarization Waves And Or Repolarization Waves, Most Of Which Are Pathologic And Few Are Physiological.
Image, 13.09MB, 10000 × 11438 jpg


Cardiologist Examining Senior Patient With Holter Device In The Department Of Cardiology In The Hospital. Woman Doctor Attaches Sensors To Measure ECG And Blood Pressure. Matury Man On Clinic Couch
Image, 9.39MB, 5472 × 3648 jpg

Cardiogram Test. Elderly Male Patient Receives Heart Rate Monitored Using Electrocardiogram Equipment With Two Doctors Cardiologist
Image, 9.13MB, 5186 × 3457 jpg

A 2:1 Left Bundle Branch Block Is Considered When Complete Left Bundle Branch Block Alternates With Normal QRS Complexes And The PR Interval Is Fixed.
Image, 5.72MB, 10000 × 3162 jpg

Impulse Encounter Effective Refractory Period Will Lead To Conduction Interruption, And Encounter Relative Refractory Period Will Lead To Conduction Delay.
Image, 5.98MB, 10000 × 6411 jpg

Cardiologist Examining Senior Patient With Holter Device In The Department Of Cardiology In The Hospital. Woman Doctor Attaches Sensors To Measure ECG And Blood Pressure. Matury Man On Clinic Couch
Image, 8.3MB, 5368 × 3579 jpg

Cardiogram Test. Elderly Male Patient Receives Heart Rate Monitored Using Electrocardiogram Equipment With Two Doctors Cardiologist
Image, 9.64MB, 3590 × 5385 jpg
Page 1 >> Next