
Stock image Right Ventricular Hypertrophy

The Typical ST-T Changing Of Left Ventricular Hypertrophy Are: ST Segment Slightly Convex With Downward Sloping Depression; Fusion Of ST Segment And Inverted T Wave; Asymmetry Of Inverted T Wave.
Image, 11.52MB, 10000 × 8453 jpg

This Is A Pathological Photo Of Human Left Ventricular Hypertrophy, Showing An Increase In Myocardial Diameter And Interstitial Distance.Magnify 40x.
Image, 42.86MB, 8500 × 8500 jpg
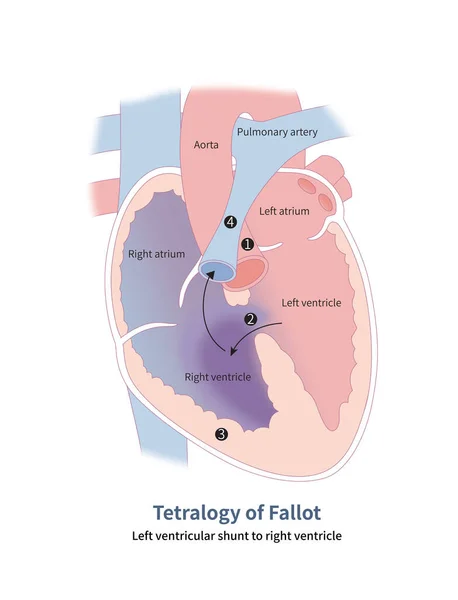
Four Anatomical Malformations Of Tetralogy Of Fallot: 1 Aortic Straddling; 2 Ventricular Septal Defect; 3 Right Ventricular Hypertrophy And 4 Pulmonary Artery Stenosis.
Image, 12.08MB, 10000 × 13070 jpg

When The Frontal QRS Axis Is At +83, The R Amplitude Of Lead AVF Is The Highest.The Frontal QRS Axis Is Almost Perpendicular To The Axis Of Lead .
Image, 11.75MB, 10000 × 6576 jpg

When The ST Segment Is Depressed, The Amplitude Of Depression At Point J And Point J60 Can Be Divided Into Three Types: Horizontal (A), Downward Sloping (B), And Upward Sloping (C).
Image, 4.91MB, 10000 × 4807 jpg

This Is A Pathological Photo Of Human Left Ventricular Hypertrophy, Showing An Increase In Myocardial Diameter And Interstitial Distance.Magnify 40x.
Image, 40.19MB, 8500 × 8500 jpg

This Is A Pathological Photo Of Human Left Ventricular Hypertrophy, Showing An Increase In Myocardial Diameter And Interstitial Distance.Magnify 40x.
Image, 41.15MB, 8500 × 8500 jpg
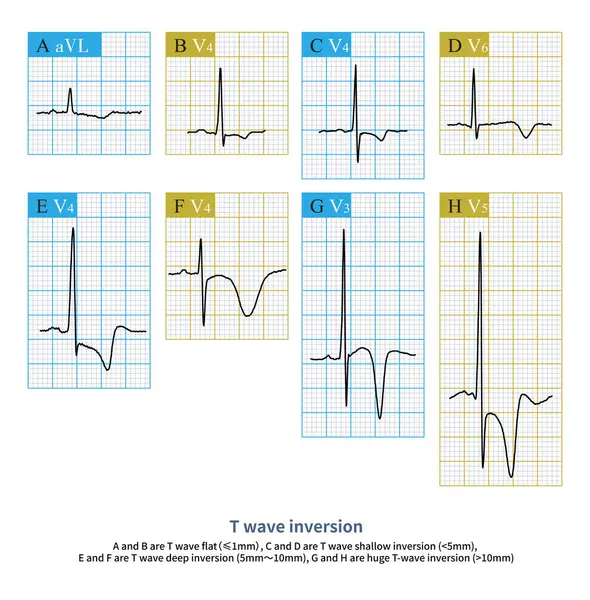
T Wave Inversion Is A Common ECG Phenomenon, Which Can Be A Normal ECG Phenomenon And Is More Common In Structural Heart Disease.
Image, 16.28MB, 10000 × 10165 jpg
Page 1 >> Next