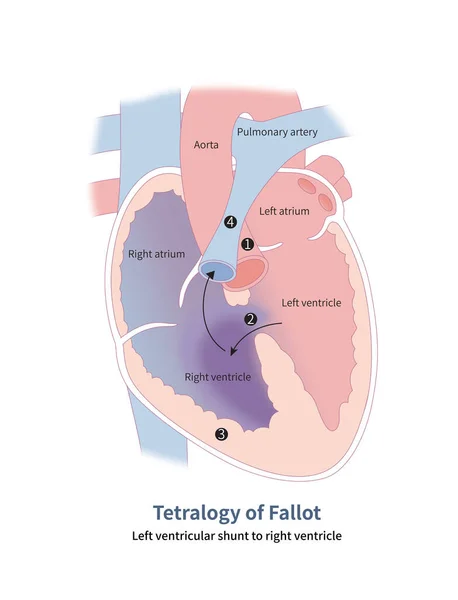
Stock image Four anatomical malformations of tetralogy of Fallot: 1 aortic straddling; 2 ventricular septal defect; 3 right ventricular hypertrophy and 4 pulmonary artery stenosis.
Published: Nov.16, 2023 12:20:57
Author: asia11m
Views: 3
Downloads: 1
File type: image / jpg
File size: 12.08 MB
Orginal size: 10000 x 13070 px
Available sizes:
Level: beginner