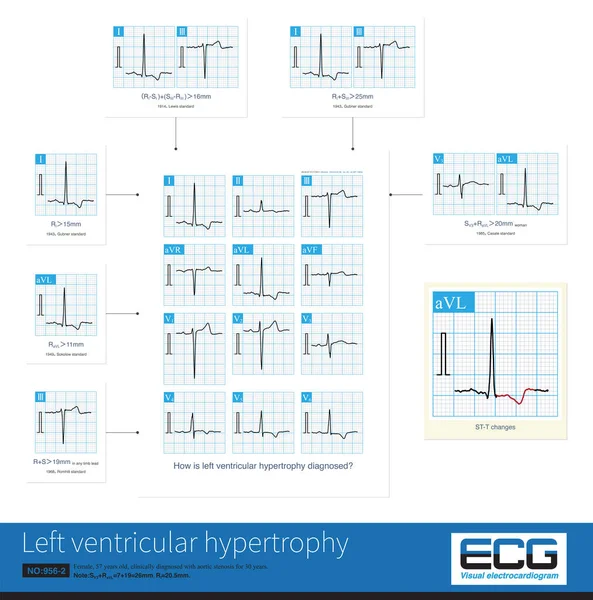
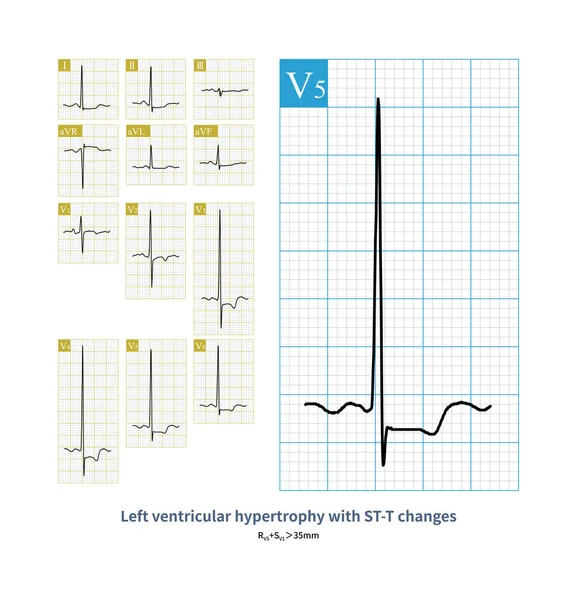
Stock image The typical ST-T changing of left ventricular hypertrophy are: ST segment slightly convex with downward sloping depression; fusion of ST segment and inverted T wave; asymmetry of inverted T wave.

Published: May.06, 2024 00:56:47
Author: asia11m
Views: 2
Downloads: 0
File type: image / jpg
File size: 11.52 MB
Orginal size: 10000 x 8453 px
Available sizes:
Level: beginner