
Stock image Sinus P Wave
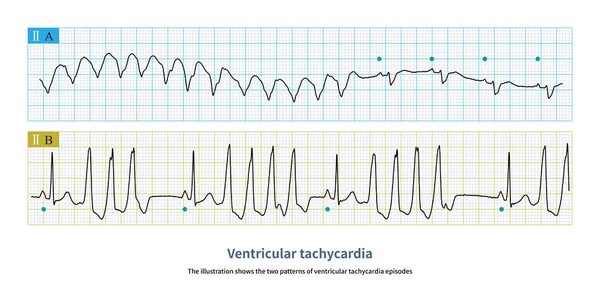
The Illustration Shows The Two Patterns Of Ventricular Tachycardia Episodes.The Green Circle Represents Sinus Rhythm. Picture A Shows Paroxysmal Episodes Of Ventricular Tachycardia, And Picture B Shows Short Bursts.
Image, 10.72MB, 10000 × 5059 jpg
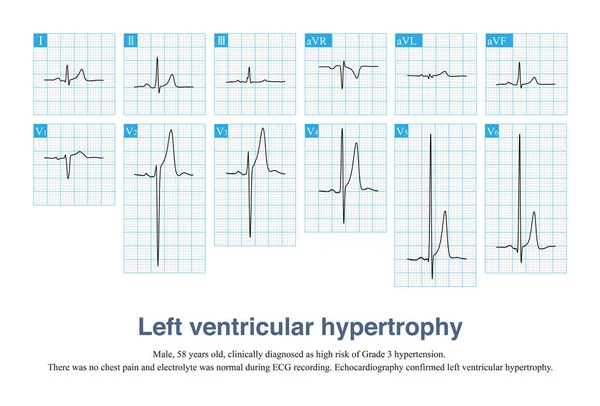
Sometimes, Left Ventricular Hypertrophy With Tall T Waves Is Easily Misdiagnosed As Hyperkalemia And Hyperacute T Waves, And ECG Needs To Be Carefully Identified In Combination With Clinic.
Image, 13.77MB, 10000 × 6782 jpg

R Wave Greater Than S Wave Is Judged To Be Positive; R Smaller Than S Is Judged To Be Negative; R Equal To S Amplitude Is Judged To Be Equipotential.
Image, 7.5MB, 10000 × 5119 jpg

The QT Interval Of ECG Is From The Beginning Of QRS Wave To The End Of T Wave, Representing The Total Time Of Ventricular Depolarization And Repolarization.
Image, 8.09MB, 10000 × 10950 jpg
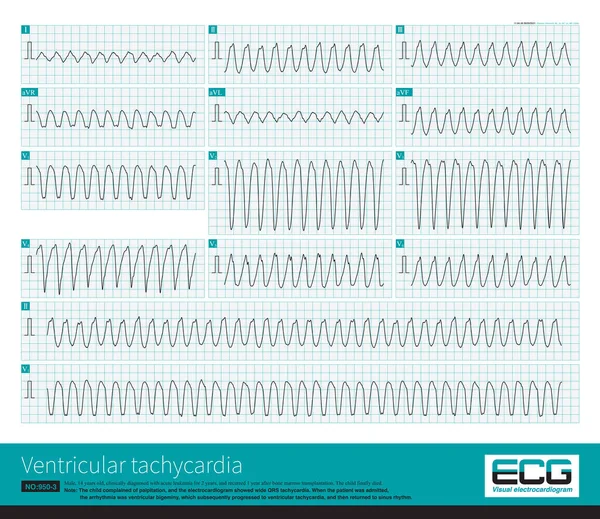
A 14-year-old Leukemic Child Had A Sudden Wide QRS Tachycardia With A Frequency Of 167 Bpm, And The Rhythm Was Regular. After Anti-arrhythmia Treatment, The Patient Recovered To Sinus Rhythm.
Image, 32.12MB, 10000 × 8649 jpg
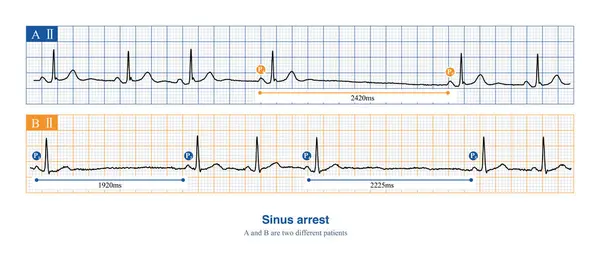
When Sinus Arrest Occurs, The Electrocardiogram Will Show A Long P-P Interval, Which Is Not Multiples Of The Basal Sinus Cycle, Including Physiological And Pathological Reasons.
Image, 8.96MB, 10000 × 4418 jpg

Abnormal ECG Refers To Changes In Depolarization Waves And Or Repolarization Waves, Most Of Which Are Pathologic And Few Are Physiological.
Image, 7.91MB, 10000 × 5625 jpg

Sometimes, There May Be Slight Non-specific Changes And Normal Variations In The Electrocardiogram, Which Are Often Due To Physiological Reasons And Have No Clinical Therapeutic Significance.
Image, 13.15MB, 10000 × 11438 jpg

Abnormal ECG Refers To Changes In Depolarization Waves And Or Repolarization Waves, Most Of Which Are Pathologic And Few Are Physiological.
Image, 13.09MB, 10000 × 11438 jpg

A 2:1 Left Bundle Branch Block Is Considered When Complete Left Bundle Branch Block Alternates With Normal QRS Complexes And The PR Interval Is Fixed.
Image, 5.72MB, 10000 × 3162 jpg
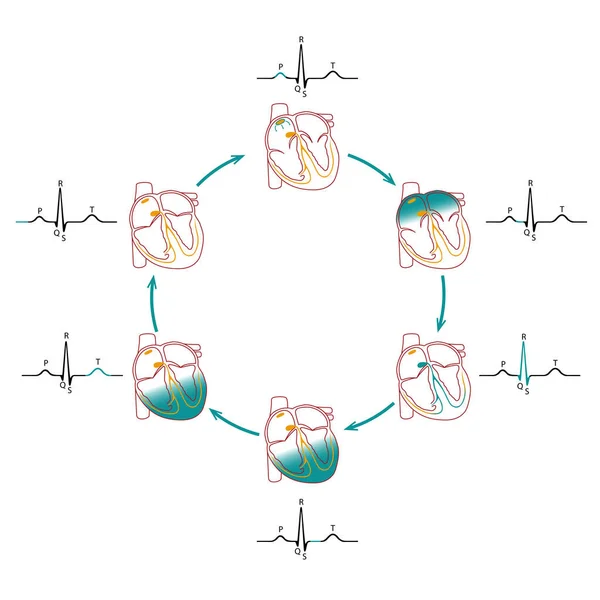
Cardiac Conduction Scheme. Electrocardiogram Tracing Correlated To The Cardiac Cycle
Vector, 6.1MB, 5209 × 5209 eps

A 67-year-old Man Presents With Heart Palpitations, Numbness Of The Lips And Nausea After Consuming Poisonous Shellfish. ECG Showed Sinus Bradycardia.
Image, 9.84MB, 10000 × 5084 jpg
Page 1 >> Next