Home
Images
Vectors
Videos
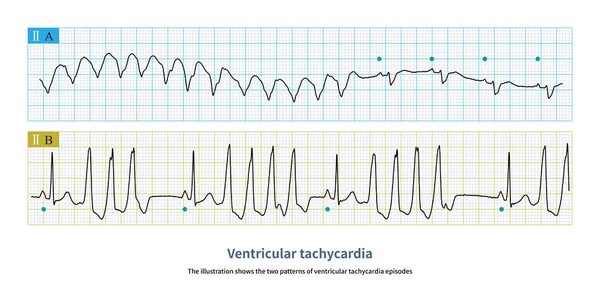
Stock image The illustration shows the two patterns of ventricular tachycardia episodes.The green circle represents sinus rhythm. Picture A shows paroxysmal episodes of ventricular tachycardia, and picture B shows short bursts.
Published:
Mar.24, 2023 13:32:56
Author:
asia11m
Views:
32
Downloads:
2
File type:
image
/
jpg
File size:
10.72 MB
Orginal size:
10000
x
5059
px
Available sizes:
S
(500 x 253)
M
(1000 x 506)
L
(2000 x 1012)
XL
(10000 x 5059)
EL0
(10000 x 5059)
Level:
beginner
Download Image
Image topics:
Graphic
Rate
Medical
Cardiology
Heart
Pulse
Science
Death
Rhythm
Diagnosis
Heartbeat
Cardiac
Ekg
Electrocardiogram
Ecg
Excitation
Palpitation
Tachycardia
Arrhythmia
Palpitations
Tachyarrhythmia
Heart Disease
Depolarization
Syncope
Cardiac Arrest
Left Ventricle
Right Ventricle
Cardiovascular Disease
Sudden Death
Sinus Rhythm
Ischemic Heart Disease
Ventricular Tachycardia
ECG Monitoring
Conduction Disorder
P Wave
Ecg Education
Qrs Wave
Wide Qrs Tachycardia
Cardiac Electrical Activity
Ventricular Depolarization
Electrocardiogram Education
Organic Heart Disease
Ventricular Fusion Wave
Atrioventricular Dissociation
Qrs Wave Alternation
Negative Consistency
Atrioventricular Separation
Ventricular Capture
Sinus Capture
Similar stock images
The Patient's Ventricular Tachycardia Has Nothing To Do With Organic Heart Disease, And The Arrhythmia Originates From The Right Ventricular Outflow Tract.
10000 × 9784
The QRS Wave Morphology Of Ventricular Tachycardia Can Be Consistent, Variable, Or Even Beat-to-beat Variant. The Latter Has Poorer Hemodynamics And Requires Urgent Treatment.
10000 × 4293
Simple Left Ventricular High Voltage Is Only An ECG Phenomenon. The Subject Has No Pathological Left Ventricular Hypertrophy And No Other Abnormal ECG Changes.
10000 × 11864
Ventricular Premature Contractions In Late Diastole Can Be Combined With Sinus Impulses To Excite The Ventricles And Produce Ventricular Fusion Waves.
10000 × 10641
Atrioventricular Dissociation Is A Clue To The Diagnosis Of VT. The Blue Arrow Shows The Sinus P Wave, Which Is Not Related To The QRS Wave. The Diagnosis Of Ventricular Tachycardia Is Clear.
10000 × 4995
A 14-year-old Leukemic Child Had A Sudden Wide QRS Tachycardia With A Frequency Of 167 Bpm, And The Rhythm Was Regular. After Anti-arrhythmia Treatment, The Patient Recovered To Sinus Rhythm.
10000 × 8649
Female, 54 Years Old, Had Recurrent Syncope For 2 Years. The Clinical Diagnosis Was Type 2 Congenital Long QT Syndrome. Her Blood Potassium Is Normal, Do Not Misdiagnose Bimodal T Wave As U Wave.
4000 × 7228
The Depolarization Time Of The Right Atrium Is Prolonged, Causing The Co-depolarization Time Of The Left And Right Atria To Be Prolonged, So The P Wave Amplitude Increases.
10000 × 6929