Home
Images
Vectors
Videos
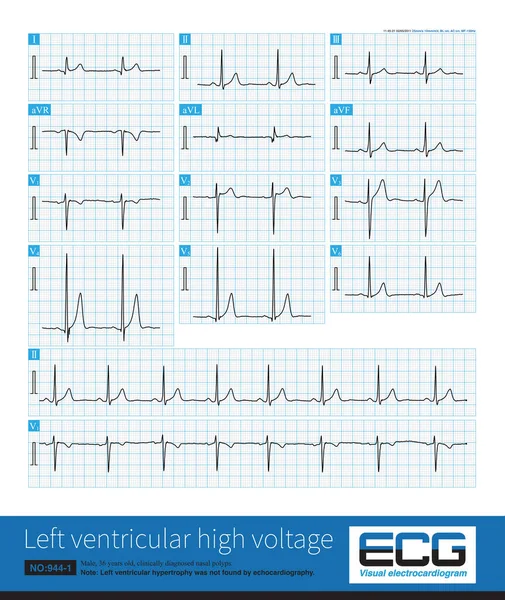
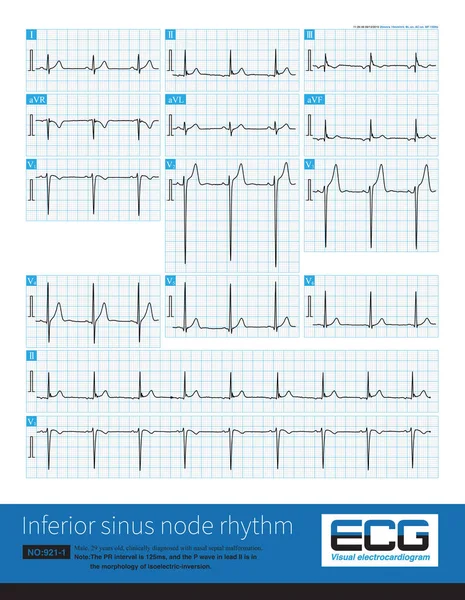
Stock image Male, 29 years old, clinically diagnosed with nasal septal malformation. Preoperative ECG is normal, note the J waves in the inferior leads.They are physiological J waves.
Published:
Jun.23, 2023 10:29:56
Author:
asia11m
Views:
11
Downloads:
0
File type:
image
/
jpg
File size:
31.47 MB
Orginal size:
10000
x
12897
px
Available sizes:
S
(388 x 500)
M
(775 x 1000)
L
(1551 x 2000)
XL
(10000 x 12897)
EL0
(10000 x 12897)
Level:
beginner
Download Image
Image topics:
Background
Graphic
Illustration
Human
Health
Healthy
Medicine
Healthcare
Medical
Line
Cardiology
Heart
Hospital
Pulse
Body
Disease
Education
Science
Death
Organ
Graph
Beat
Rhythm
Diagnosis
Heartbeat
Cardiogram
Cardiac
Ekg
Electrocardiogram
Atrium
Ecg
Arrhythmias
Heart Disease
Cardiac Arrest
Left Ventricle
Sudden Death
Right Atrium
ECG Monitoring
Atrioventricular Node
Sinus Node
P Wave
St Segment
Ecg Education
Qrs Wave
J Point
J Wave
St Segment Elevation
Similar stock images
Simple Left Ventricular High Voltage Is Only An ECG Phenomenon. The Subject Has No Pathological Left Ventricular Hypertrophy And No Other Abnormal ECG Changes.
10000 × 11864
Note That The V3 Lead Of This ECG Shows That The Amplitude Of R Wave Is Greater Than The Amplitude Of S Wave, And There Is Counterclockwise Rotation.
10000 × 11469
Male, 76 Years Old, Clinically Diagnosed With Coronary Heart Disease. ECG Showed That Sinus Rhythm And Rapid Junctional Rhythm Alternate, With The Latter Being The Predominant.
10000 × 7714
An 11 Month Old Male Infant Was Clinically Diagnosed With Cytomegalovirus Myocarditis. The Child Experienced A Brief Atrioventricular Block After A Ventricular Tachycardia Attack.
10000 × 6929
Sometimes, Because The QRS Axis Is In The Upper Left Quadrant, The High-amplitude R Wave Of Left Ventricular Hypertrophy Occurs In The Limb Leads, And Left Chest Leads Is Normal.
10000 × 11694
A 4-year-old Boy With A Clinical Diagnosis Of Long QT Syndrome. No Genetic Testing Was Done During Hospitalization. The Child Died Suddenly During Follow-up.
10000 × 9250
When The Electrical Axis Deviates To The Right, The Maximum QRS Vector Is Located In The Lower Right Quadrant, Which Can Be Interpreted In Combination With The QRS Wave Characteristics Of Limb Leads.
10000 × 7207