
Stock image P Wave

The QT Interval Of ECG Is From The Beginning Of QRS Wave To The End Of T Wave, Representing The Total Time Of Ventricular Depolarization And Repolarization.
Image, 8.09MB, 10000 × 10950 jpg
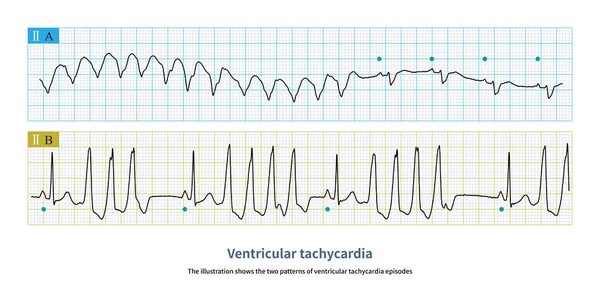
The Illustration Shows The Two Patterns Of Ventricular Tachycardia Episodes.The Green Circle Represents Sinus Rhythm. Picture A Shows Paroxysmal Episodes Of Ventricular Tachycardia, And Picture B Shows Short Bursts.
Image, 10.72MB, 10000 × 5059 jpg
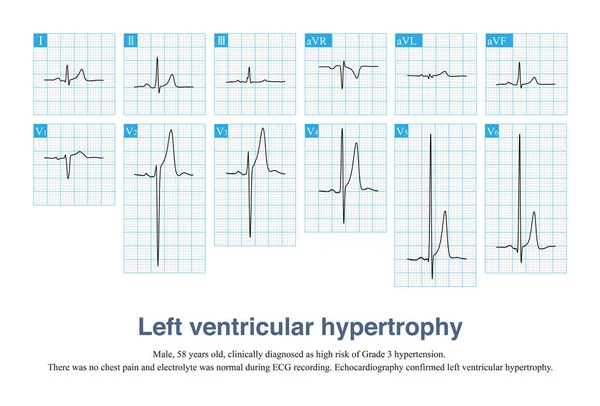
Sometimes, Left Ventricular Hypertrophy With Tall T Waves Is Easily Misdiagnosed As Hyperkalemia And Hyperacute T Waves, And ECG Needs To Be Carefully Identified In Combination With Clinic.
Image, 13.77MB, 10000 × 6782 jpg
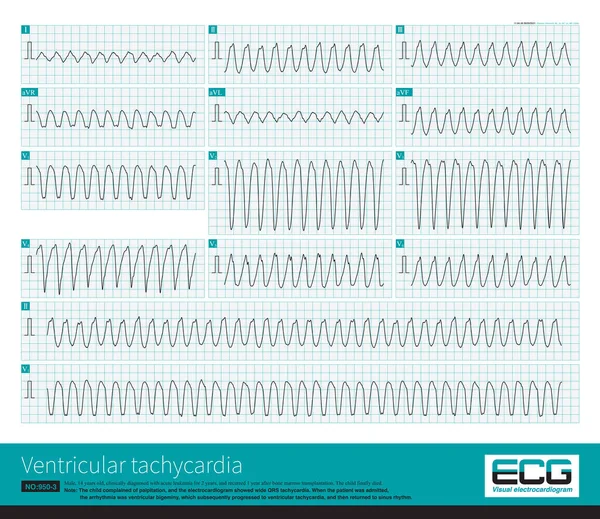
A 14-year-old Leukemic Child Had A Sudden Wide QRS Tachycardia With A Frequency Of 167 Bpm, And The Rhythm Was Regular. After Anti-arrhythmia Treatment, The Patient Recovered To Sinus Rhythm.
Image, 32.12MB, 10000 × 8649 jpg

R Wave Greater Than S Wave Is Judged To Be Positive; R Smaller Than S Is Judged To Be Negative; R Equal To S Amplitude Is Judged To Be Equipotential.
Image, 7.5MB, 10000 × 5119 jpg

ECG In Atrial Fibrillation (AFib), A 3D Illustration Depicting Irregular Rhythm, Absent P Waves, And Rapid, Chaotic Atrial Activity, Posing A Risk Of Palpitations And Stroke.
Image, 11.04MB, 9000 × 6000 jpg
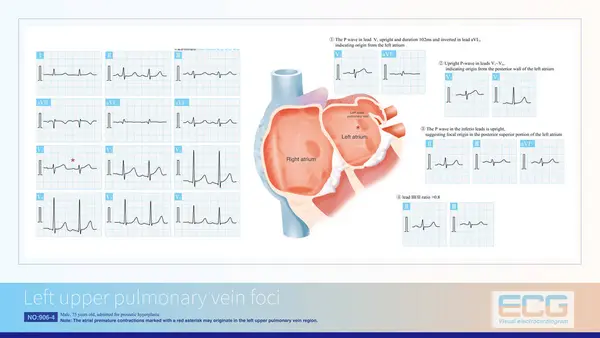
Atrial Focal Originating In The Left Upper Pulmonary Vein, With An Upright P Wave In V1 And Wide Duration, Inverted P Wave In Lead AVL And An Upright P Wave With Notch In Inferior Leads.
Image, 12.65MB, 10000 × 5632 jpg

The Effective Refractory Period Of The Ventricular Muscle Is Equivalent To The Time From The Onset Of QRS To The Peak Of The T Wave On The ECG.
Image, 9.8MB, 10000 × 10568 jpg

The Presence Of Atrioventricular Dissociation In Wide-complex Tachycardia Is Highly Suggestive Of Ventricular Tachycardia.
Image, 11.09MB, 10000 × 5896 jpg
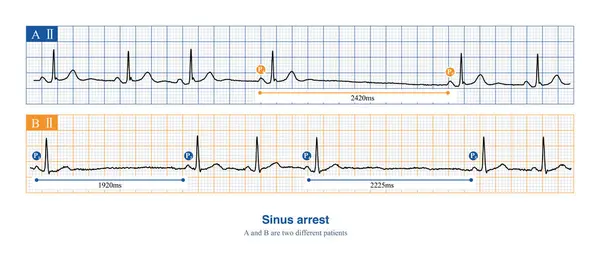
When Sinus Arrest Occurs, The Electrocardiogram Will Show A Long P-P Interval, Which Is Not Multiples Of The Basal Sinus Cycle, Including Physiological And Pathological Reasons.
Image, 8.96MB, 10000 × 4418 jpg

ECG In Atrial Fibrillation (AFib), A 3D Illustration Depicts Irregular Rhythm, Absent P Waves, And Rapid, Chaotic Atrial Activity, Posing A Risk Of Palpitations And Stroke.
Image, 4.42MB, 9000 × 4000 jpg
ECG In Atrial Fibrillation (AFib), A 3D Illustration Depicts Irregular Rhythm, Absent P Waves, And Rapid, Chaotic Atrial Activity, Posing A Risk Of Palpitations And Stroke.
Image, 13MB, 9000 × 4000 jpg

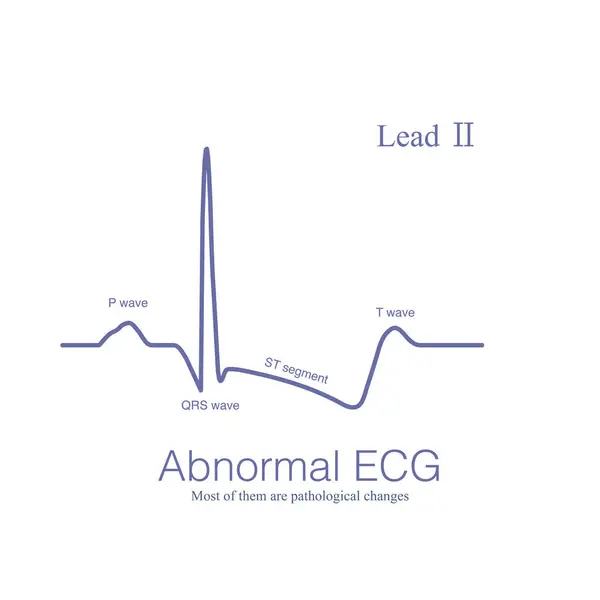
Abnormal ECG Refers To Changes In Depolarization Waves And Or Repolarization Waves, Most Of Which Are Pathologic And Few Are Physiological.
Image, 7.91MB, 10000 × 5625 jpg
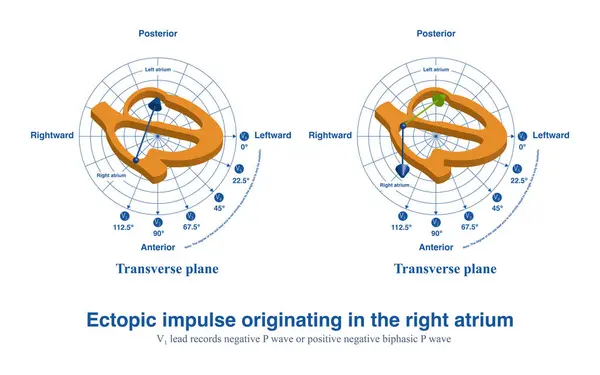
When Ectopic Impulses From The Anterior Wall Of The Right Atrium Produce A Completely Negative P Wave In Lead V1, The Posterior Wall Ectopic Impulse Produces A Positive And Negative Biphasic P Wave.
Image, 8.22MB, 10000 × 6252 jpg

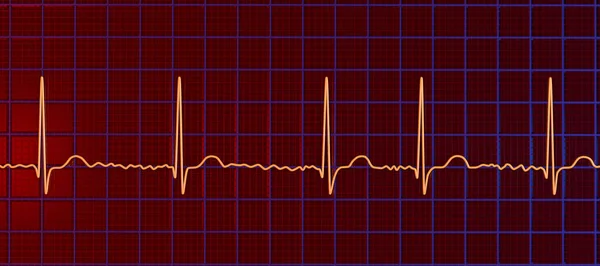
Sinus Heart Rate Less Than 60 Beats Per Minute In Adults Is Called Sinus Bradycardia. A Sinus Heart Rate Of 40 To 50 Beats Per Minute Is Moderate Sinus Bradycardia, And Patients May Have Symptoms Such As Palpitations And Dizziness.
Image, 6.83MB, 10000 × 3842 jpg

When The Limb Leads Are Reversed, It Is Common For The Left Upper Limb And The Right Upper Limb To Be Reversed, Affecting The ECG Pattern Of The Limb Leads.
Image, 9.69MB, 10000 × 5625 jpg

When Ectopic Focal Areas In The Atria Are Located In The Atrial Septum, The Left Atrium And Right Atrium Can Be Excited At The Same Time, Producing A Very Narrow P Wave.
Image, 10.55MB, 10000 × 13011 jpg

Ventricular Tachycardia Originating From The Right Ventricular Outflow Tract Can Be Sustained Or Short-burst, And Is A Benign Idiopathic Ventricular Tachycardia.
Image, 32.6MB, 10000 × 13078 jpg

Sometimes, There May Be Slight Non-specific Changes And Normal Variations In The Electrocardiogram, Which Are Often Due To Physiological Reasons And Have No Clinical Therapeutic Significance.
Image, 13.15MB, 10000 × 11438 jpg

Abnormal ECG Refers To Changes In Depolarization Waves And Or Repolarization Waves, Most Of Which Are Pathologic And Few Are Physiological.
Image, 13.09MB, 10000 × 11438 jpg
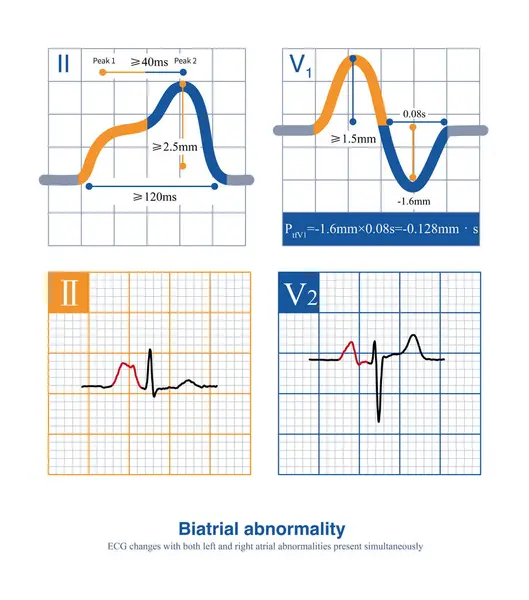
When The Duration Of The P Wave Exceeds 120 Ms, The Amplitude Of The Limb Leads Exceeds 2.5 Mm, And The Amplitude Of The Thoracic Leads Exceeds 1.5 Mm, It Is Interpreted As A Biatrial Abnormality.
Image, 12.77MB, 10000 × 11335 jpg

When Intraatrial Excitation Is Transmitted From One Atrium To The Other, A Wider Duration Of P Waves Are Generated, Such As Sinus Rhythm, Lateral Left Atrial Focal, Etc.
Image, 4.32MB, 10426 × 13565 jpg

When Intraatrial Excitation Is Transmitted From One Atrium To The Other, A Wider Duration Of P Waves Are Generated, Such As Sinus Rhythm, Lateral Left Atrial Focal, Etc.
Image, 8.11MB, 10000 × 5456 jpg
Abnormal ECG Refers To Changes In Depolarization Waves And Or Repolarization Waves, Most Of Which Are Pathologic And Few Are Physiological.
Image, 7.34MB, 10000 × 10000 jpg
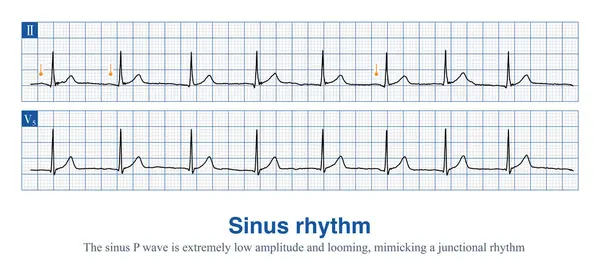
Sometimes, The P Wave Amplitude Of Sinus Rhythm Is So Low That It Is Close To An Isopotential And Can Easily Be Mistaken For A Borderline Rhythm.
Image, 8.33MB, 11811 × 5448 jpg
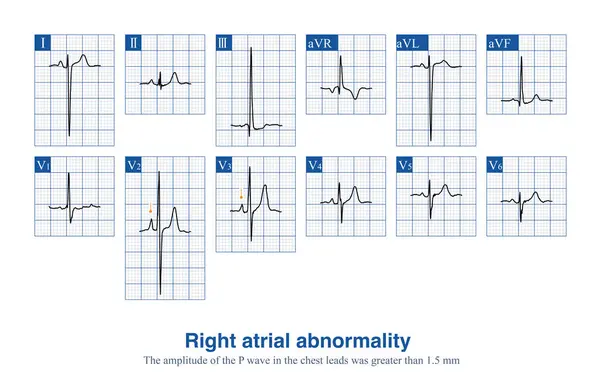
Male, 10 Years Old, Was Clinically Diagnosed With Tetralogy Of Fallot. ECG Shows An Elevated P Wave Amplitude In Thoracic Leads, Suggesting Right Atrial Abnormality.
Image, 11.1MB, 10000 × 6539 jpg

Impulse Encounter Effective Refractory Period Will Lead To Conduction Interruption, And Encounter Relative Refractory Period Will Lead To Conduction Delay.
Image, 5.98MB, 10000 × 6411 jpg

A 2:1 Left Bundle Branch Block Is Considered When Complete Left Bundle Branch Block Alternates With Normal QRS Complexes And The PR Interval Is Fixed.
Image, 5.72MB, 10000 × 3162 jpg
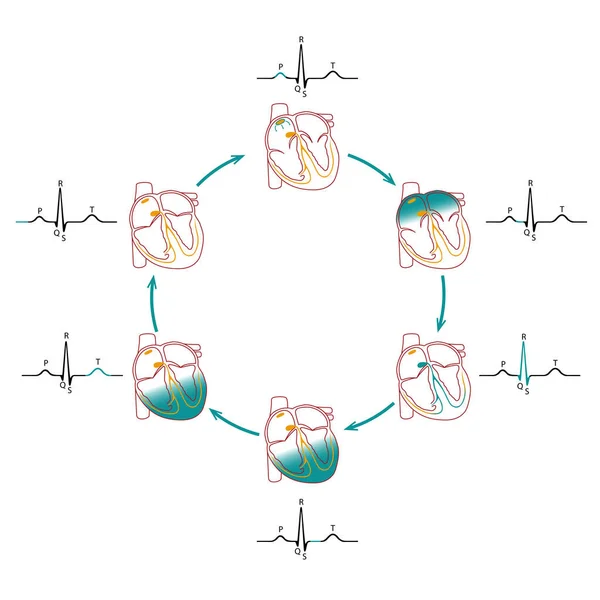
Cardiac Conduction Scheme. Electrocardiogram Tracing Correlated To The Cardiac Cycle
Vector, 6.1MB, 5209 × 5209 eps

A 67-year-old Man Presents With Heart Palpitations, Numbness Of The Lips And Nausea After Consuming Poisonous Shellfish. ECG Showed Sinus Bradycardia.
Image, 9.84MB, 10000 × 5084 jpg

The Presence Of Atrioventricular Dissociation In Wide-complex Tachycardia Is Highly Suggestive Of Ventricular Tachycardia.
Image, 14.3MB, 10000 × 6909 jpg

Sinus Heart Rate Less Than 60 Beats Per Minute In Adults Is Called Sinus Bradycardia. A Sinus Heart Rate Of 40 To 50 Beats Per Minute Is Moderate Sinus Bradycardia, And Patients May Have Symptoms Such As Palpitations And Dizziness.
Image, 10.18MB, 10000 × 5282 jpg

When The Limb Leads Are Reversed, It Is Common For The Left Upper Limb And The Right Upper Limb To Be Reversed, Affecting The ECG Pattern Of The Limb Leads.
Image, 12.91MB, 10000 × 11438 jpg

ECG In Atrial Fibrillation (AFib), A 3D Illustration Depicts Irregular Rhythm, Absent P Waves, And Rapid, Chaotic Atrial Activity, Posing A Risk Of Palpitations And Stroke.
Image, 8.46MB, 9000 × 4000 jpg


Page 1 >> Next