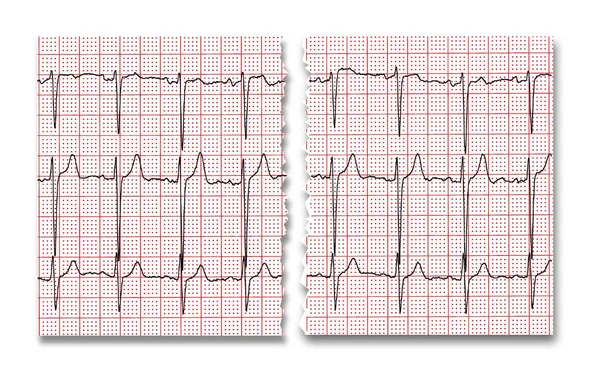
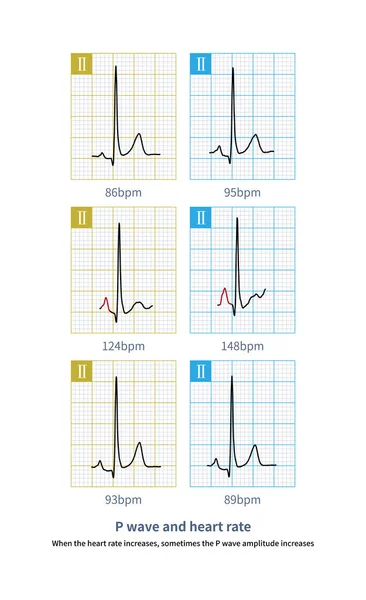
Stock image When the heart rate increases, sometimes the P wave amplitude increases.This is a physiological phenomenon, do not diagnose the right atrial abnormality.
Published: May.08, 2023 08:48:55
Author: asia11m
Views: 11
Downloads: 0
File type: image / jpg
File size: 13.77 MB
Orginal size: 8000 x 13087 px
Available sizes:
Level: beginner