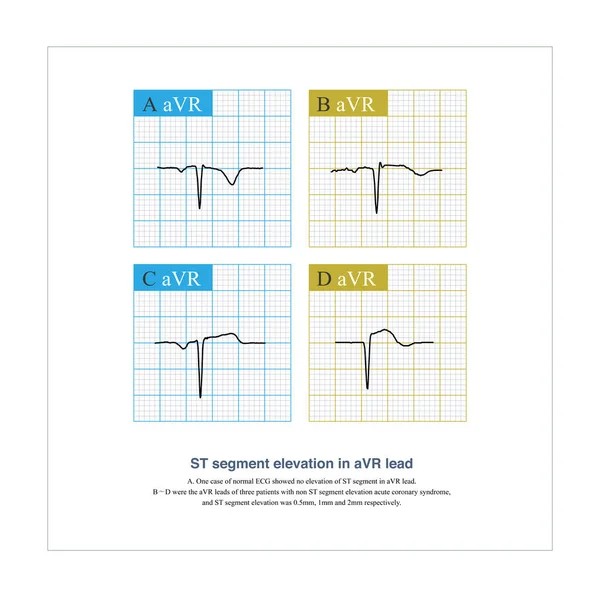
Stock image According to the offset amplitude of the ST segment at J point and J60 point, ST segment elevation can be divided into three basic types: concave upward, oblique straight and concave downward type.

Published: Apr.24, 2024 11:37:10
Author: asia11m
Views: 2
Downloads: 0
File type: image / jpg
File size: 5.11 MB
Orginal size: 10000 x 4837 px
Available sizes:
Level: beginner