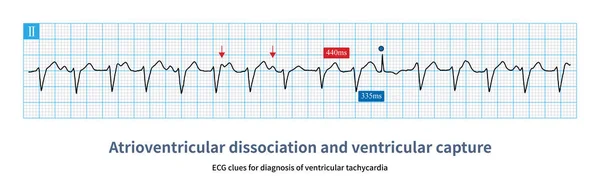
Stock image If atrioventricular dissociation and ventricular capture are found during wide QRS tachycardia, it supports the diagnosis of ventricular tachycardia with high specificity and poor sensitivity.
Published: Mar.15, 2023 09:05:27
Author: asia11m
Views: 9
Downloads: 0
File type: image / jpg
File size: 6.37 MB
Orginal size: 10000 x 3269 px
Available sizes:
Level: beginner