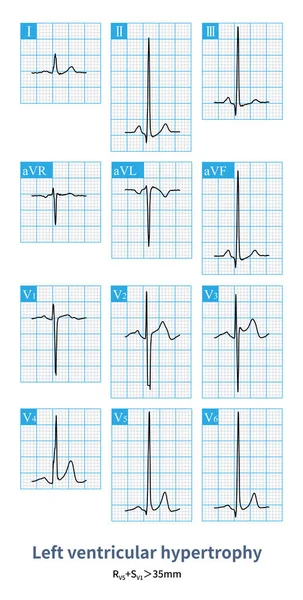
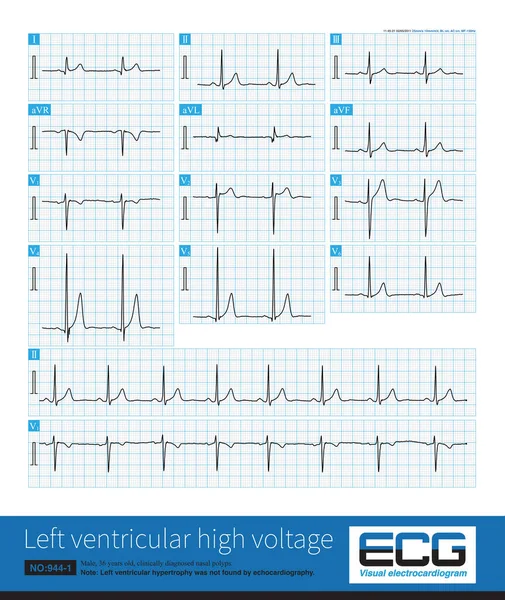
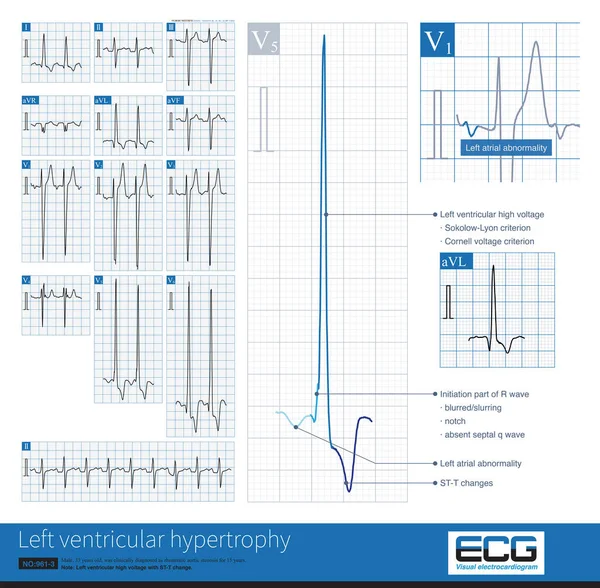
Stock image Female, 58 years old, clinically diagnosed with aortic stenosis. Electrocardiogram showed left ventricular hypertrophy and ST-T changes.
Published: May.22, 2023 15:05:43
Author: asia11m
Views: 16
Downloads: 0
File type: image / jpg
File size: 14.99 MB
Orginal size: 10000 x 10362 px
Available sizes:
Level: beginner