Home
Images
Vectors
Videos
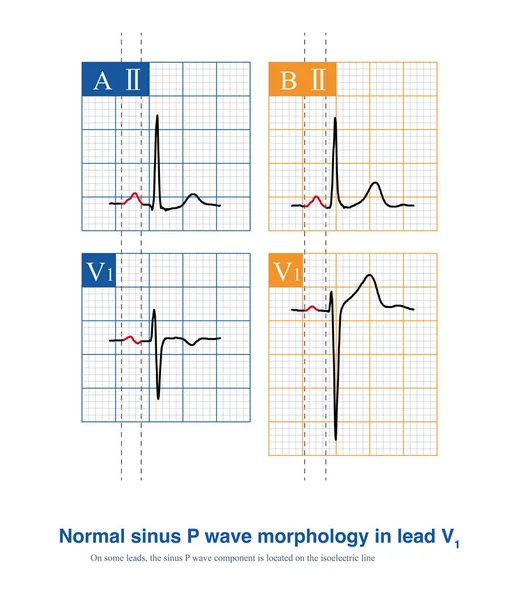
Stock image The morphology of a normal P wave can be smooth or notched, but the peak-to-peak spacing formed by the notch must be less than 40 ms.
Published:
Jan.05, 2024 13:36:16
Author:
asia11m
Views:
0
Downloads:
0
File type:
image
/
jpg
File size:
5.74 MB
Orginal size:
10000
x
6889
px
Available sizes:
S
(500 x 344)
M
(1000 x 689)
L
(2000 x 1378)
XL
(10000 x 6889)
EL0
(10000 x 6889)
Level:
beginner
Download Image
Image topics:
Blue
Background
Graphic
Health
Medical
Line
Wave
Symbol
Cardiology
Heart
Disease
Education
Science
Graph
Rhythm
Projection
Diagnosis
Anatomy
Interval
Notch
Duration
Electrode
Cardiogram
Cardiac
Ekg
Electrocardiogram
Atrium
Ecg
Electrocardiograph
Heart Rate
Left Atrium
Sinus Rhythm
Right Atrium
Action Potential
Limb Leads
Sinus Node
P Wave
QRS Complex
Cardiovascular Medicine
St Segment
Ecg Education
U Wave
Cardiac Electrical Activity
Frontal Lead System
Lead Axis
Lead Systems
Hexaxial Reference System
Lead V1
Similar stock images
The Correct Measurement Of ECG Amplitude Should Be From The Upper Edge Of The Baseline To The Peak Or The Lower Edge Of The Baseline To The Trough.
10000 × 10240
Under Normal Circumstances, The Sinus P Wave Is The First ECG Wave, As The Sinus Node Is Very Small And The Electrical Activity Generated Cannot Be Recorded By The ECG Machine.
9000 × 13557
When The Left Atrium Is Diseased, The Depolarization Time Of The Left Atrium Is Prolonged, And The Duration Of The Sinus P Wave On The Electrocardiogram Increases By More Than 120ms.
10000 × 10091
Normally, The P Wave In Lead V1 Is Either Positive Or Negative Biphasic Or Upright, With The Latter Noting That A Portion Of The P Wave Is Actually On The Isoelectric Line.
10000 × 11552
On The 12-lead ECG, Under Normal Circumstances, The T Wave Polarity Of Most Leads Is Consistent With The Polarity Of The Main Wave Of The Same Lead QRS
10000 × 12082
A Normal Electrocardiogram ECG, 3D Illustration Displaying The Electrical Activity Of The Heart In A Healthy Individual.
9000 × 6000
There Are Only Three Basic Polarities In Electrocardiogram Recordings: Isoelectric Line, Positive Wave Above Isoelectric Line, And Negative Wave Below Isoelectric Line.
10000 × 9269
The Mechanism Of Brugada Syndrome Is The Difference Of Repolarization Phase 1 And Phase 2 Between Epicardium And Endocardium, And The Loss Of Epicardial Plateau Leads To ST Segment Elevation.
8000 × 15162