photo free
Home Images Vectors Videos

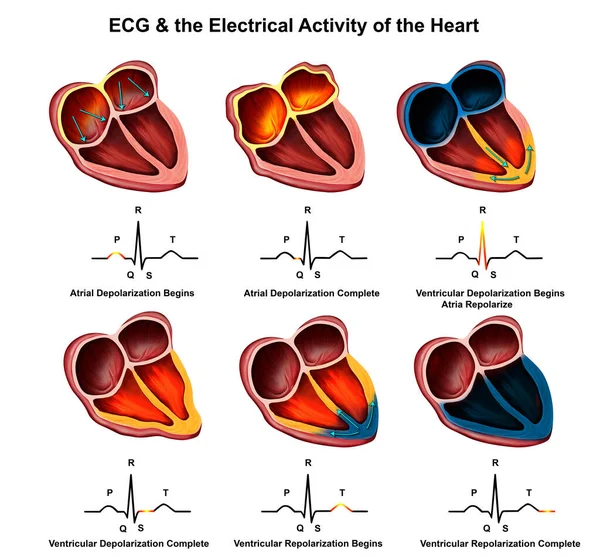
Stock image Cardiac Electrical Activity

stock image Electrocardiogram hospital examination. Sheet that represents a diagnostic test, of an instrumental type, which records and graphically reports the rhythm and electrical activity of the heart

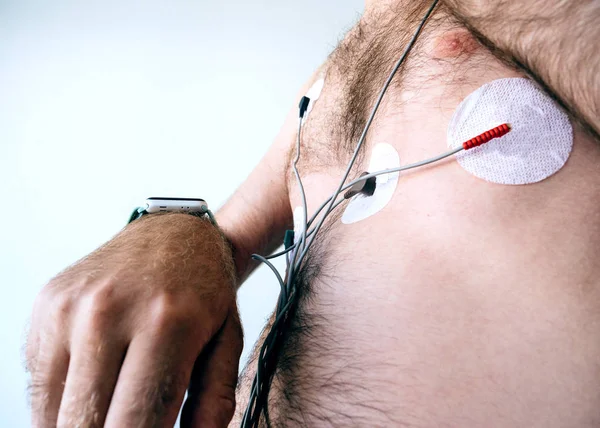
Electrocardiogram Hospital Examination. Sheet That Represents A Diagnostic Test, Of An Instrumental Type, Which Records And Graphically Reports The Rhythm And Electrical Activity Of The Heart

Image, 8.23MB, 3946 × 2896 jpg
stock image  Medical illustration of  Anatomy of Heart Attack

Medical Illustration Of Anatomy Of Heart Attack

Image, 2.11MB, 8031 × 5000 jpg
stock image  Medical illustration of  ECG & the Electrical Activity of the Heart

Medical Illustration Of ECG & The Electrical Activity Of The Heart

Image, 12.13MB, 8031 × 8410 jpg
stock image  Medical illustration of  Anatomy of Heart Attack

Medical Illustration Of Anatomy Of Heart Attack

Image, 4.93MB, 8031 × 5168 jpg
stock image  Medical illustration of heart attack caused cholesterol

Medical Illustration Of Heart Attack Caused Cholesterol

Image, 3.73MB, 5000 × 3113 jpg
stock image  Medical illustration of  heart attack

Medical Illustration Of Heart Attack

Image, 4.23MB, 5000 × 5409 jpg
stock image  Medical illustration of Heart

Medical Illustration Of Heart

Image, 5.78MB, 5000 × 7156 jpg
stock image  Medical illustration of  Coronary Artery Disease

Medical Illustration Of Coronary Artery Disease

Image, 7.81MB, 8031 × 5000 jpg
stock image  Medical illustration of  Open Heart With labeling

Medical Illustration Of Open Heart With Labeling

Image, 6.76MB, 10160 × 7836 jpg
stock image  Medical illustration of  heart attack

Medical Illustration Of Heart Attack

Image, 3.08MB, 5000 × 3113 jpg
stock image  Medical illustration of  Heart Coronary Artery Disease

Medical Illustration Of Heart Coronary Artery Disease

Image, 6.33MB, 8031 × 5168 jpg
stock image  Medical illustration of  Blood flow through the heart

Medical Illustration Of Blood Flow Through The Heart

Image, 7.46MB, 10160 × 8364 jpg
stock image  Medical illustration of  blood flow in human circular system

Medical Illustration Of Blood Flow In Human Circular System

Image, 5.11MB, 6000 × 6640 jpg
stock vector Electrocardiography ECG or EKG machine recording electrical activity of heart

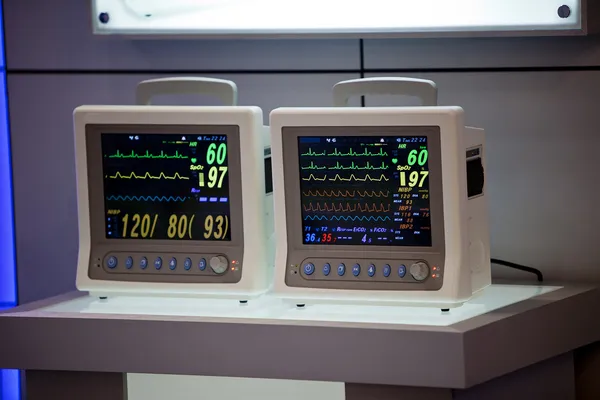
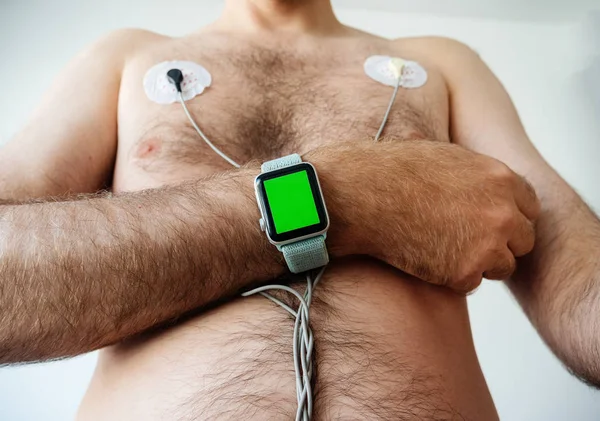
Electrocardiography ECG Or EKG Machine Recording Electrical Activity Of Heart

Vector, 4.73MB, 5000 × 5000 eps
stock image  Medical illustration of  ECG explained

Medical Illustration Of ECG Explained

Image, 9.54MB, 8031 × 7471 jpg
stock image patient on going electrocardiography

Patient On Going Electrocardiography

Image, 10.42MB, 7360 × 4912 jpg
stock image Zero line

Zero Line

Image, 3.79MB, 5787 × 3858 jpg
stock image  Medical illustration of  Open Heart

Medical Illustration Of Open Heart

Image, 5.48MB, 5000 × 7156 jpg
stock image  Medical illustration of  Open Heart  valves operation

Medical Illustration Of Open Heart Valves Operation

Image, 5.71MB, 5486 × 5486 jpg
stock image Holter Monitor

Holter Monitor

Image, 1.62MB, 3000 × 2000 jpg
stock vector Healthy heart illustration

Healthy Heart Illustration

Vector, 2.1MB, 4961 × 3508 eps
stock vector Healthy heart illustration

Healthy Heart Illustration

Vector, 2.08MB, 9094 × 6431 eps
stock image Real tape with the cardiogram of man. Image of Electrocardiogram close-up.

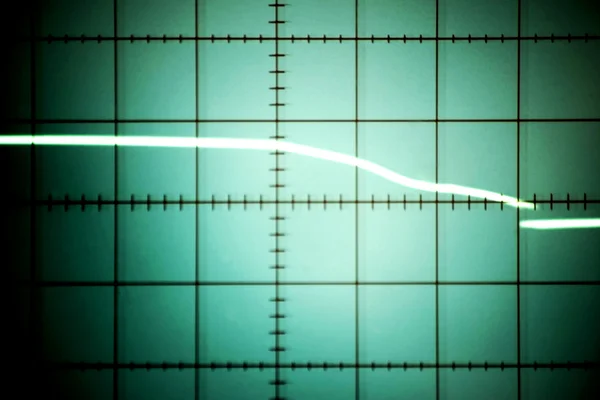
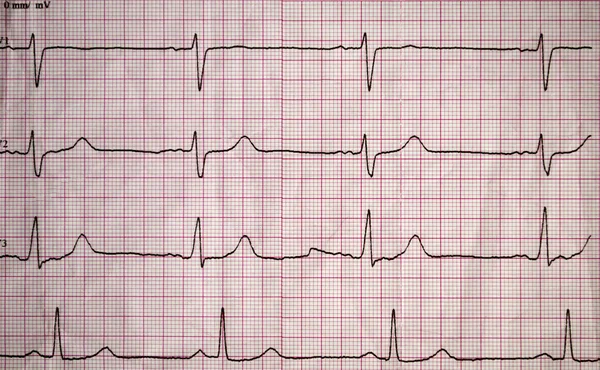
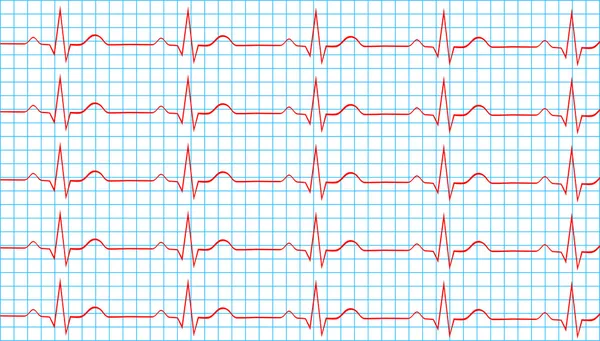
Real Tape With The Cardiogram Of Man. Image Of Electrocardiogram Close-up.

Image, 10.19MB, 4748 × 2928 jpg
stock vector Heart Normal Sinus Rhythm On Electrocardiogram Record

Heart Normal Sinus Rhythm On Electrocardiogram Record

Vector, 1.04MB, 15000 × 1720 eps
stock vector Heartbeat or Heart beat. Cardiogram.

Heartbeat Or Heart Beat. Cardiogram.

Vector, 0.74MB, 4167 × 4167 eps
stock image Bidirectional ventricular tachycardia is a kind of malignant arrhythmia. The polarity of QRS main wave alternates from beat to beat, and it is easy to degenerate into ventricular fibrillation.

Bidirectional Ventricular Tachycardia Is A Kind Of Malignant Arrhythmia. The Polarity Of QRS Main Wave Alternates From Beat To Beat, And It Is Easy To Degenerate Into Ventricular Fibrillation.

Image, 10.66MB, 10000 × 4450 jpg
stock image R wave greater than S wave is judged to be positive; R smaller than S  is judged to be negative; R equal to S amplitude is judged to be equipotential.

R Wave Greater Than S Wave Is Judged To Be Positive; R Smaller Than S Is Judged To Be Negative; R Equal To S Amplitude Is Judged To Be Equipotential.

Image, 7.5MB, 10000 × 5119 jpg
stock image The illustration shows the two patterns of ventricular tachycardia episodes.The green circle represents sinus rhythm. Picture A shows paroxysmal episodes of ventricular tachycardia, and picture B shows short bursts.

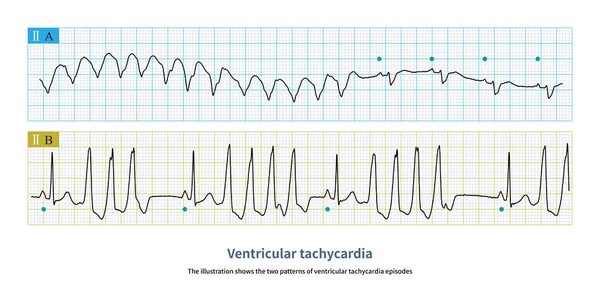
The Illustration Shows The Two Patterns Of Ventricular Tachycardia Episodes.The Green Circle Represents Sinus Rhythm. Picture A Shows Paroxysmal Episodes Of Ventricular Tachycardia, And Picture B Shows Short Bursts.

Image, 10.72MB, 10000 × 5059 jpg
stock vector Heart Normal Sinus Rhythm On Electrocardiogram Record

Heart Normal Sinus Rhythm On Electrocardiogram Record

Vector, 4.85MB, 7000 × 3983 eps
stock image Intensive care unit.

Intensive Care Unit.

Image, 5.83MB, 5616 × 3744 jpg
stock vector Heart Attack Stroke On Electrocardiogram Record

Heart Attack Stroke On Electrocardiogram Record

Vector, 2.5MB, 10000 × 2876 eps
stock vector Pacemaker and red heart

Pacemaker And Red Heart

Vector, 2.08MB, 6000 × 4742 eps
stock vector Equipment for making electrocardiogram, wires clips and fasteners, electrocardiography

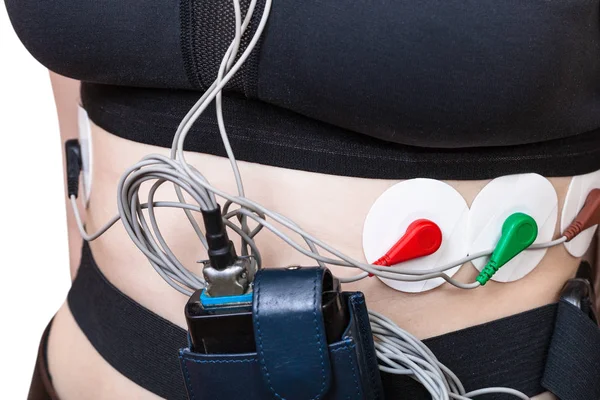
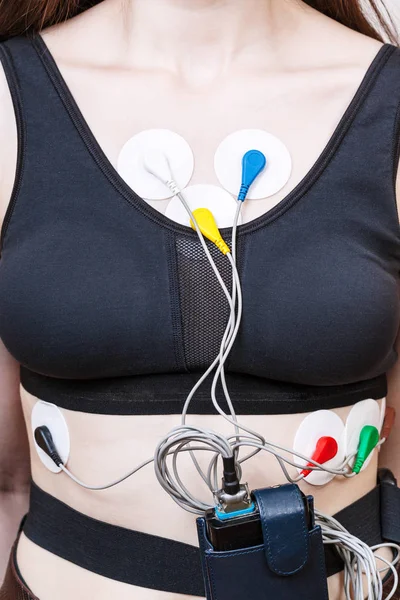
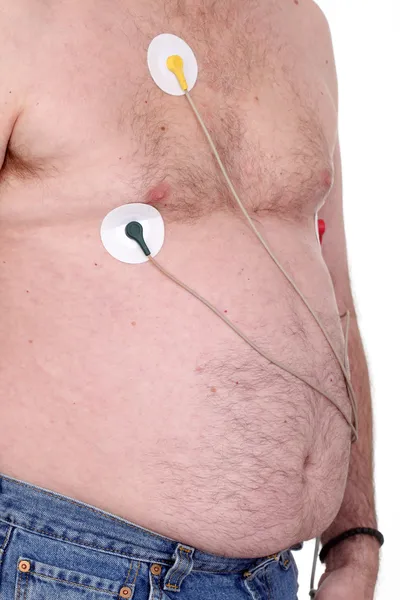
Equipment For Making Electrocardiogram, Wires Clips And Fasteners, Electrocardiography

Vector, 5MB, 5000 × 5000 eps
stock image Man setting smartwatch wearing a heart monitor holter

Man Setting Smartwatch Wearing A Heart Monitor Holter

Image, 9.45MB, 4500 × 3217 jpg
stock image The QT interval of ECG is from the beginning of QRS wave to the end of T wave, representing the total time of ventricular depolarization and repolarization.

The QT Interval Of ECG Is From The Beginning Of QRS Wave To The End Of T Wave, Representing The Total Time Of Ventricular Depolarization And Repolarization.

Image, 8.09MB, 10000 × 10950 jpg
stock image Man setting smartwatch wearing a heart monitor holter

Man Setting Smartwatch Wearing A Heart Monitor Holter

Image, 11.46MB, 5184 × 3642 jpg
stock image sensors and recorder of Holter monitoring on torso

Sensors And Recorder Of Holter Monitoring On Torso

Image, 6.86MB, 4200 × 2800 jpg
stock vector EKG showing normal heartbeat wave. ECG of Normal Sinus Rhythm infographic diagram.

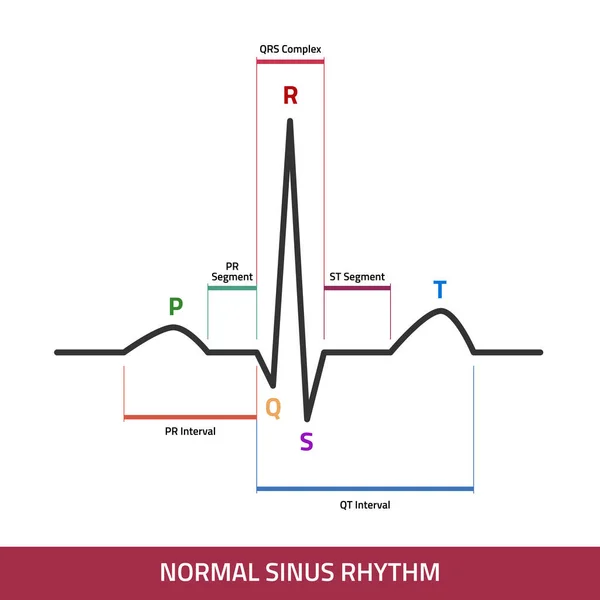
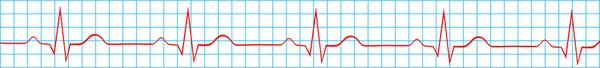
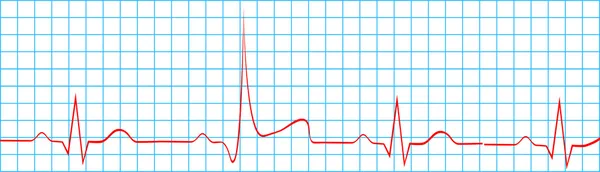
EKG Showing Normal Heartbeat Wave. ECG Of Normal Sinus Rhythm Infographic Diagram.

Vector, 0.61MB, 5000 × 5000 eps
stock image Medical monitor indicators of cardiac activity

Medical Monitor Indicators Of Cardiac Activity

Image, 2.96MB, 4838 × 3000 jpg
stock image sensors and recorder of Holter monitor on body

Sensors And Recorder Of Holter Monitor On Body

Image, 8.49MB, 3000 × 4500 jpg
stock image Man setting smartwatch wearing a heart monitor holter

Man Setting Smartwatch Wearing A Heart Monitor Holter

Image, 10.12MB, 4500 × 3607 jpg
stock image Heart with electrocardiogram device

Heart With Electrocardiogram Device

Image, 3.98MB, 5000 × 5000 jpg
stock image Carry

Carry

Image, 3.66MB, 5000 × 5000 jpg
stock image Electrocardiogram

Electrocardiogram

Image, 3.32MB, 2000 × 3000 jpg
stock image When the left free wall and septal accessory pathway are excited, preexcitation waves with different polarities are generated in leads  and aVL.

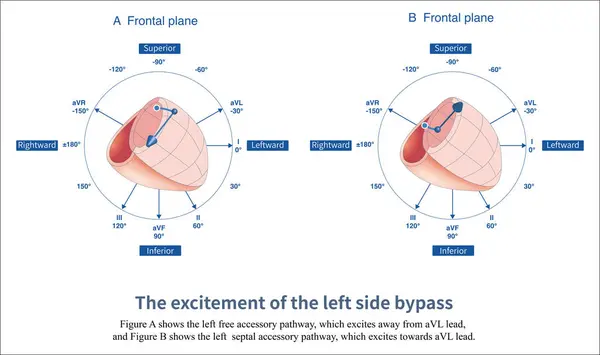
When The Left Free Wall And Septal Accessory Pathway Are Excited, Preexcitation Waves With Different Polarities Are Generated In Leads And AVL.

Image, 6.98MB, 14851 × 8810 jpg
stock image Some accessory pathways directly connect atrium with the lower part of atrioventricular node and His bundle, bypassing the slow conduction area of atrioventricular node.

Some Accessory Pathways Directly Connect Atrium With The Lower Part Of Atrioventricular Node And His Bundle, Bypassing The Slow Conduction Area Of Atrioventricular Node.

Image, 10.59MB, 7000 × 13649 jpg
stock image When sinus arrest occurs, the electrocardiogram will show a long P-P interval, which is not multiples of the basal sinus cycle, including physiological and pathological reasons.

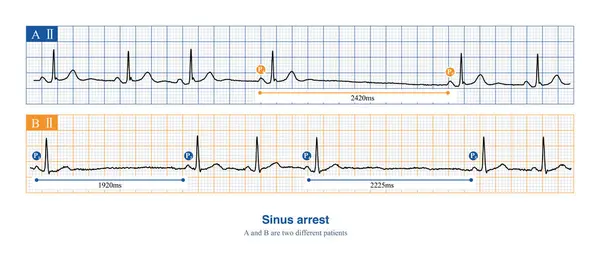
When Sinus Arrest Occurs, The Electrocardiogram Will Show A Long P-P Interval, Which Is Not Multiples Of The Basal Sinus Cycle, Including Physiological And Pathological Reasons.

Image, 8.96MB, 10000 × 4418 jpg
stock image When the rhythm of the atria originates in the lower part of the atria, the whole atria are excited from inferior to superior, producing negative P waves in the inferior leads.

When The Rhythm Of The Atria Originates In The Lower Part Of The Atria, The Whole Atria Are Excited From Inferior To Superior, Producing Negative P Waves In The Inferior Leads.

Image, 11.92MB, 10000 × 8280 jpg
stock image On the electrocardiogram, observing the morphology of QRS waves in lead V1 can distinguish whether ventricular pre excitation is located in the left ventricle or the right ventricle.

On The Electrocardiogram, Observing The Morphology Of QRS Waves In Lead V1 Can Distinguish Whether Ventricular Pre Excitation Is Located In The Left Ventricle Or The Right Ventricle.

Image, 4.78MB, 10000 × 11226 jpg
stock image When the ventricular preexcitation wave leaves the baseline and then falls back to the baseline, it is interpreted as an isoelectric line preexcitation wave.

When The Ventricular Preexcitation Wave Leaves The Baseline And Then Falls Back To The Baseline, It Is Interpreted As An Isoelectric Line Preexcitation Wave.

Image, 9.3MB, 10000 × 11275 jpg
Page 1 >> Next