photo free
Home Images Vectors Videos

Stock image Electrocardiogram Education page 2

stock vector Human heart beat, isolated on white

Human Heart Beat, Isolated On White

Vector, 8.75MB, 5440 × 4550 eps
stock vector Medical clipboard

Medical Clipboard

Vector, 0.44MB, 2800 × 2800 eps
stock image Generally, when the sinus heart rate is below 60 beats per minute, it is called sinus bradycardia. This arrhythmia can be both physiological and often pathological.

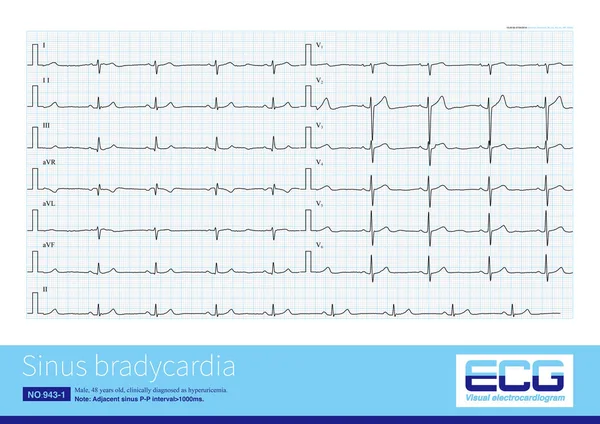
Generally, When The Sinus Heart Rate Is Below 60 Beats Per Minute, It Is Called Sinus Bradycardia. This Arrhythmia Can Be Both Physiological And Often Pathological.

Image, 20.38MB, 10000 × 7069 jpg
stock image Male, 60 years old, clinically diagnosed as acute extensive anterior wall myocardial infarction. The patient died of ventricular fibrillation after admission.

Male, 60 Years Old, Clinically Diagnosed As Acute Extensive Anterior Wall Myocardial Infarction. The Patient Died Of Ventricular Fibrillation After Admission.

Image, 10.58MB, 10000 × 6427 jpg
stock image Note that the V3 lead of this ECG shows that the amplitude of R wave is greater than the amplitude of S wave, and there is counterclockwise rotation.

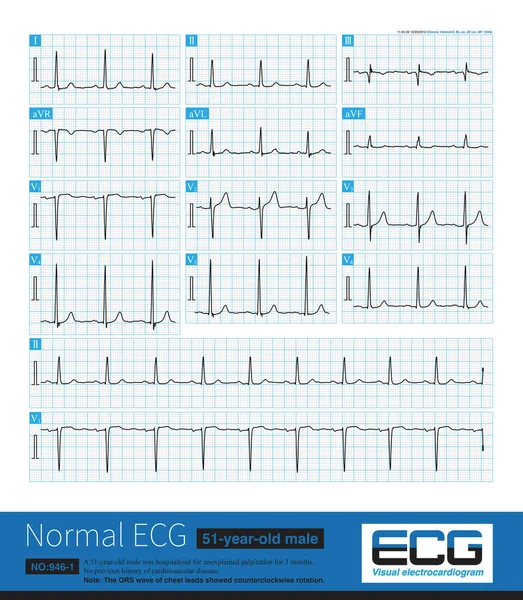
Note That The V3 Lead Of This ECG Shows That The Amplitude Of R Wave Is Greater Than The Amplitude Of S Wave, And There Is Counterclockwise Rotation.

Image, 33.74MB, 10000 × 11469 jpg
stock image ECG with a heart attack in hospital ward

ECG With A Heart Attack In Hospital Ward

Image, 4.32MB, 4500 × 3000 jpg
stock image eart beats cardiogram

Eart Beats Cardiogram

Image, 2.7MB, 4400 × 2452 jpg
stock image Male, 60 years old, clinically diagnosed as acute extensive anterior wall myocardial infarction. The patient died of ventricular fibrillation after admission.

Male, 60 Years Old, Clinically Diagnosed As Acute Extensive Anterior Wall Myocardial Infarction. The Patient Died Of Ventricular Fibrillation After Admission.

Image, 6.05MB, 10000 × 4656 jpg
stock vector Colorful human heart normal sinus rhythm, electrocardiogram record. Bright and bold design

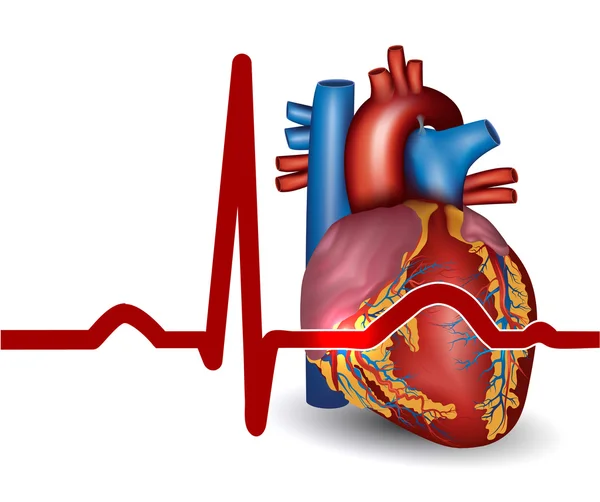
Colorful Human Heart Normal Sinus Rhythm, Electrocardiogram Record. Bright And Bold Design

Vector, 0.73MB, 4710 × 3042 eps
stock vector Medical clipboard

Medical Clipboard

Vector, 0.45MB, 2800 × 2800 eps
stock image Stethoscope and red toy heart lying on electrocardiogram on blue background closeup

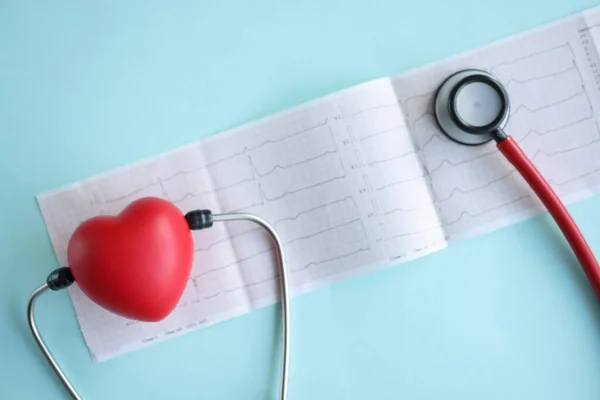
Stethoscope And Red Toy Heart Lying On Electrocardiogram On Blue Background Closeup

Image, 11.7MB, 8192 × 5464 jpg
stock image Woman doctor showing heart model to students

Woman Doctor Showing Heart Model To Students

Image, 9.6MB, 6016 × 4016 jpg
stock image watercolor heart health, and cardiogram. heart disease, heart rate. syringe treatment

Watercolor Heart Health, And Cardiogram. Heart Disease, Heart Rate. Syringe Treatment

Image, 6.35MB, 4793 × 4792 jpg
stock vector ECG Electrocardiogram medical background

ECG Electrocardiogram Medical Background

Vector, 0.36MB, 6900 × 5174 eps
stock image Young team or group of doctors

Young Team Or Group Of Doctors

Image, 4.49MB, 4279 × 2863 jpg
stock vector ECG of Normal Sinus Rhythm infographic diagram showing normal heart beat wave including intervals segments and complex for medical science education and health care

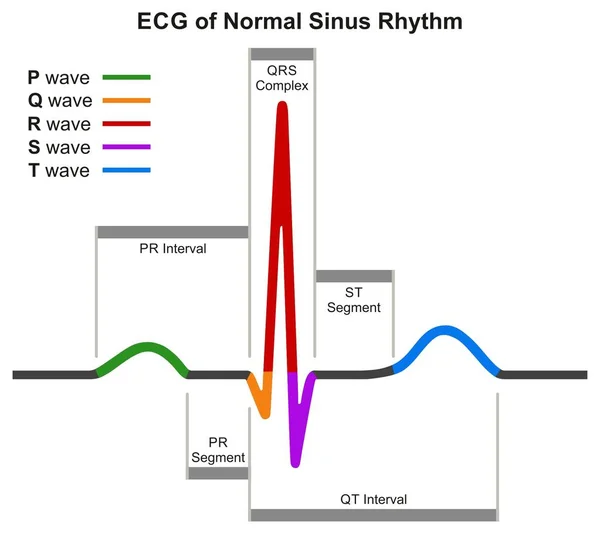
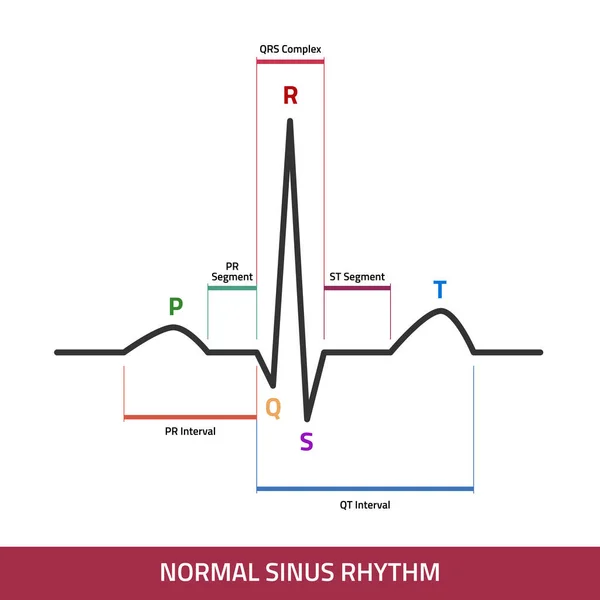
ECG Of Normal Sinus Rhythm Infographic Diagram Showing Normal Heart Beat Wave Including Intervals Segments And Complex For Medical Science Education And Health Care

Vector, 0.15MB, 2169 × 1933 eps
stock image watercolor heart health, and cardiogram. heart disease, heart rate.

Watercolor Heart Health, And Cardiogram. Heart Disease, Heart Rate.

Image, 5.97MB, 4792 × 4792 jpg
stock image Female, 51 years old, diagnosed with mitral stenosis. When this ECG was taken, the patient still maintained sinus rhythm.Note that the P wave duration was widened.

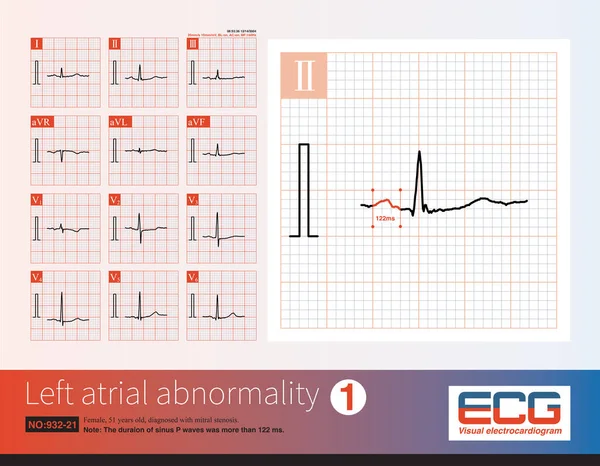
Female, 51 Years Old, Diagnosed With Mitral Stenosis. When This ECG Was Taken, The Patient Still Maintained Sinus Rhythm.Note That The P Wave Duration Was Widened.

Image, 14.21MB, 10000 × 7772 jpg
stock image Doctors cardiologists looking at cardiogram on tablet and showing it with pen

Doctors Cardiologists Looking At Cardiogram On Tablet And Showing It With Pen

Image, 12.02MB, 8192 × 5464 jpg
stock image clipboard with heartbeat

Clipboard With Heartbeat

Image, 1.58MB, 3000 × 3303 jpg
stock image In acute myocardial ischemia, the amplitude of T wave is increased first, and then the ST segment is elevated. When the end of QRS wave is deformed,  there is a lack of collateral circulation.

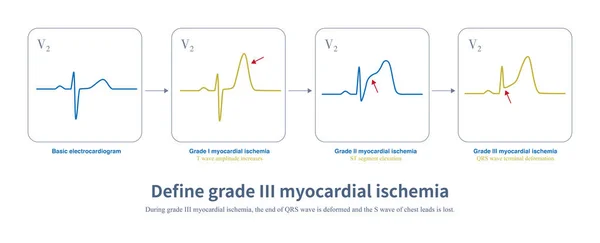
In Acute Myocardial Ischemia, The Amplitude Of T Wave Is Increased First, And Then The ST Segment Is Elevated. When The End Of QRS Wave Is Deformed, There Is A Lack Of Collateral Circulation.

Image, 1.32MB, 10108 × 4093 jpg
stock image The QT interval of ECG is from the beginning of QRS wave to the end of T wave, representing the total time of ventricular depolarization and repolarization.

The QT Interval Of ECG Is From The Beginning Of QRS Wave To The End Of T Wave, Representing The Total Time Of Ventricular Depolarization And Repolarization.

Image, 8.09MB, 10000 × 10950 jpg
stock vector EKG showing normal heartbeat wave. ECG of Normal Sinus Rhythm infographic diagram.

EKG Showing Normal Heartbeat Wave. ECG Of Normal Sinus Rhythm Infographic Diagram.

Vector, 0.61MB, 5000 × 5000 eps
stock image In acute high lateral myocardial infarction, there is indicative ST segment elevation in leads I and aVL, and corresponding ST segment depression in leads II, III and aVF.

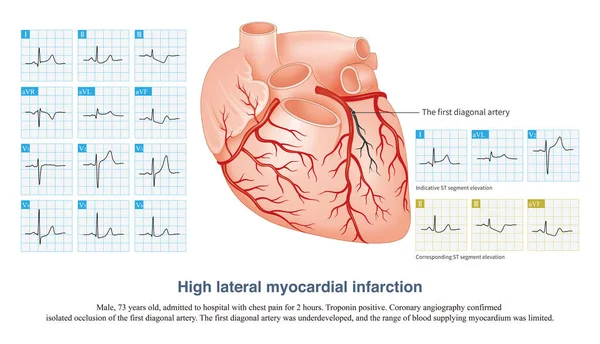
In Acute High Lateral Myocardial Infarction, There Is Indicative ST Segment Elevation In Leads I And AVL, And Corresponding ST Segment Depression In Leads II, III And AVF.

Image, 12.63MB, 10000 × 5739 jpg
stock image Female anesthesiologist with vital functions monitor in surgery room (color toned image; shallow DOF)

Female Anesthesiologist With Vital Functions Monitor In Surgery Room (color Toned Image; Shallow DOF)

Image, 9.66MB, 5760 × 3840 jpg
stock vector Human heart normal sinus rhythm, electrocardiogram

Human Heart Normal Sinus Rhythm, Electrocardiogram

Vector, 0.4MB, 5000 × 5000 eps
stock image The young female doctor cardiologist sitting at the hospital

The Young Female Doctor Cardiologist Sitting At The Hospital

Image, 2.77MB, 2683 × 2962 jpg
stock image Doctor hand writing message TAKE IT EASY!

Doctor Hand Writing Message TAKE IT EASY!

Image, 3.96MB, 4752 × 3326 jpg
stock vector Abstract medical background. Vector

Abstract Medical Background. Vector

Vector, 7.63MB, 5000 × 3333 eps
stock vector Abstract medical background. Vector

Abstract Medical Background. Vector

Vector, 2.78MB, 5000 × 3333 eps
stock image Smiling female doctor in glasses

Smiling Female Doctor In Glasses

Image, 3.32MB, 3532 × 3509 jpg
stock image Smiling female doctor with stethoscope

Smiling Female Doctor With Stethoscope

Image, 3.61MB, 3707 × 3249 jpg
stock image Ventricular tachyarrhythmia includes many clinical types, some benign and some malignant. For malignant ventricular arrhythmias, patients are at risk of death.

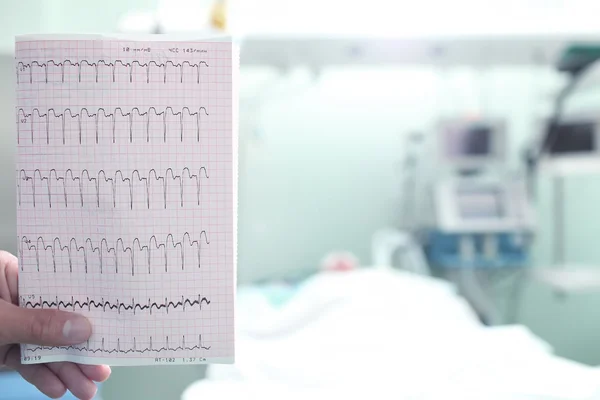
Ventricular Tachyarrhythmia Includes Many Clinical Types, Some Benign And Some Malignant. For Malignant Ventricular Arrhythmias, Patients Are At Risk Of Death.

Image, 27.66MB, 8000 × 10973 jpg
stock vector Health And Medical Timeline Infographic

Health And Medical Timeline Infographic

Vector, 2.58MB, 4000 × 4000 eps
stock image Atrial depolarization forms a P wave, ventricular depolarization forms a QRS wave, and ventricular repolarization forms a T wave, which constitutes a common waveform of the electrocardiogram.

Atrial Depolarization Forms A P Wave, Ventricular Depolarization Forms A QRS Wave, And Ventricular Repolarization Forms A T Wave, Which Constitutes A Common Waveform Of The Electrocardiogram.

Image, 9.59MB, 10000 × 9917 jpg
stock image Doctor hand writing message ALERT

Doctor Hand Writing Message ALERT

Image, 3.86MB, 4751 × 3326 jpg
stock vector medicine line icons. linear set. quality vector line set such as antibiotic, hospital, doctor, ecg, medical book, heart rate, cancer, test tubes

Medicine Line Icons. Linear Set. Quality Vector Line Set Such As Antibiotic, Hospital, Doctor, Ecg, Medical Book, Heart Rate, Cancer, Test Tubes

Vector, 0.62MB, 5556 × 5556 eps
stock image Cardiology concept

Cardiology Concept

Image, 3.29MB, 4819 × 4819 jpg
stock image A 14-year-old leukemic child had a sudden wide QRS tachycardia with a frequency of 167 bpm, and the rhythm was regular. After anti-arrhythmia treatment, the patient recovered to sinus rhythm.

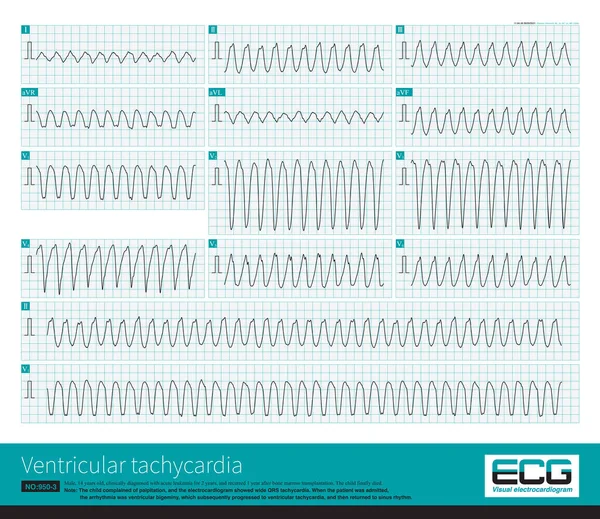
A 14-year-old Leukemic Child Had A Sudden Wide QRS Tachycardia With A Frequency Of 167 Bpm, And The Rhythm Was Regular. After Anti-arrhythmia Treatment, The Patient Recovered To Sinus Rhythm.

Image, 32.12MB, 10000 × 8649 jpg
stock vector set of 16 medical items concept vector line icons. 64x64 thin stroke icons such as data, microscope, ecg, injection, blood, hospital, eye, stethoscope, heart

Set Of 16 Medical Items Concept Vector Line Icons. 64x64 Thin Stroke Icons Such As Data, Microscope, Ecg, Injection, Blood, Hospital, Eye, Stethoscope, Heart

Vector, 0.61MB, 7639 × 7639 eps
stock vector Pulse rate chart for healthy lifestyle. Maximum heart rate. Healthy heart, weight management, aerobic and anaerobic zone. maximum heart rate by age. Vector illustration for education, science and medical use

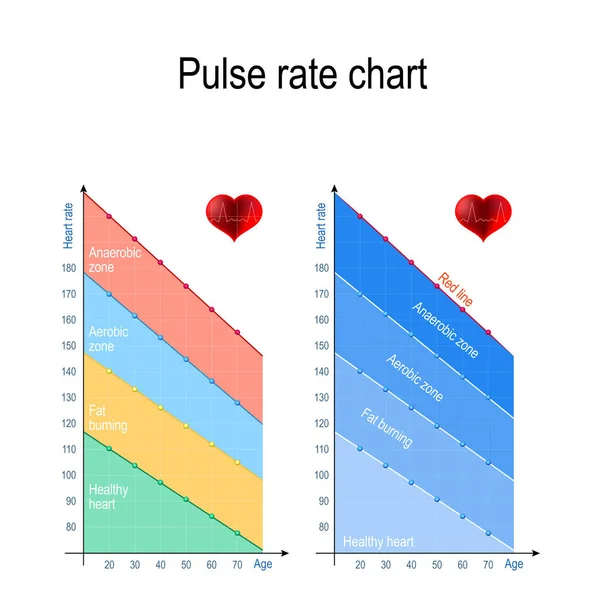
Pulse Rate Chart For Healthy Lifestyle. Maximum Heart Rate. Healthy Heart, Weight Management, Aerobic And Anaerobic Zone. Maximum Heart Rate By Age. Vector Illustration For Education, Science And Medical Use

Vector, 0.83MB, 4134 × 4134 eps
stock image Medicine doctor consulting with her colleague

Medicine Doctor Consulting With Her Colleague

Image, 10.11MB, 5760 × 3840 jpg
stock image Cardiogram

Cardiogram

Image, 3.92MB, 3200 × 1800 jpg
stock image At present, there is a younger trend in patients with acute myocardial infarction, so it is important to check the ECG for acute chest pain in young people.

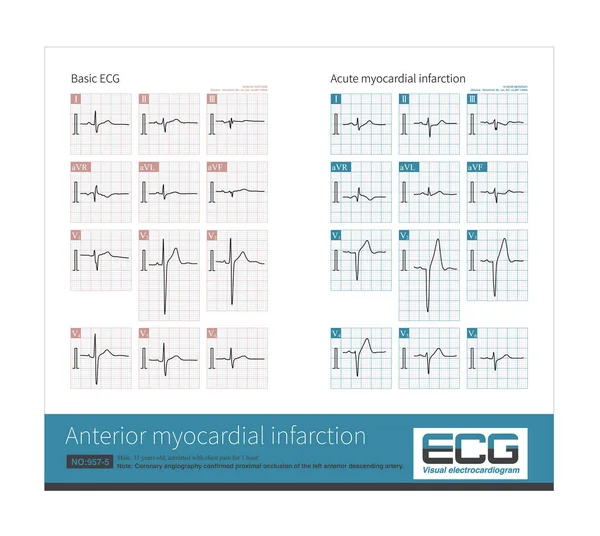
At Present, There Is A Younger Trend In Patients With Acute Myocardial Infarction, So It Is Important To Check The ECG For Acute Chest Pain In Young People.

Image, 15.75MB, 10000 × 8939 jpg
stock vector Poster for World Health Day.

Poster For World Health Day.

Vector, 3.88MB, 4167 × 4167 eps
stock image In complete left bundle branch block, the conduction of the LBB can be completely interrupted or can still be conducted, but it is delayed by at least 45ms than the RBB.

In Complete Left Bundle Branch Block, The Conduction Of The LBB Can Be Completely Interrupted Or Can Still Be Conducted, But It Is Delayed By At Least 45ms Than The RBB.

Image, 10.8MB, 10000 × 5497 jpg
stock vector Chest ecg leads placement illustration. Six colored electrocardiography leads

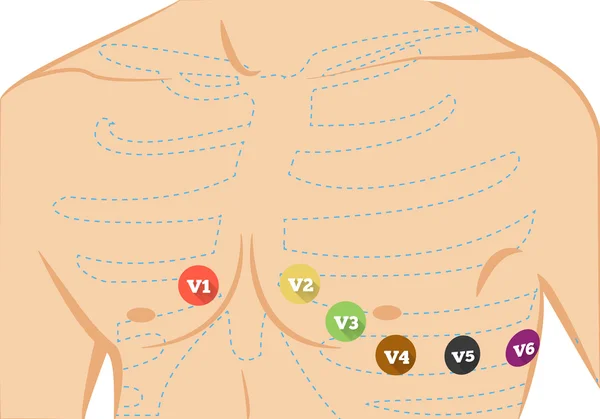
Chest Ecg Leads Placement Illustration. Six Colored Electrocardiography Leads

Vector, 2.82MB, 5714 × 4000 eps
stock vector Vector illustration for World Health Day

Vector Illustration For World Health Day

Vector, 3.38MB, 4167 × 4167 eps
stock vector Pill Capsule Lungs Health And Medical Infographic

Pill Capsule Lungs Health And Medical Infographic

Vector, 13.95MB, 4000 × 4000 eps
stock image Coronary artery spasm causes transmural myocardial ischemia, and ST segment elevation in ECG has localization characteristics. Criminal vessels can be derived from ST segment elevation leads in ECG.

Coronary Artery Spasm Causes Transmural Myocardial Ischemia, And ST Segment Elevation In ECG Has Localization Characteristics. Criminal Vessels Can Be Derived From ST Segment Elevation Leads In ECG.

Image, 11.66MB, 10000 × 7684 jpg
Previous << Page 2 >> Next