Home
Images
Vectors
Videos
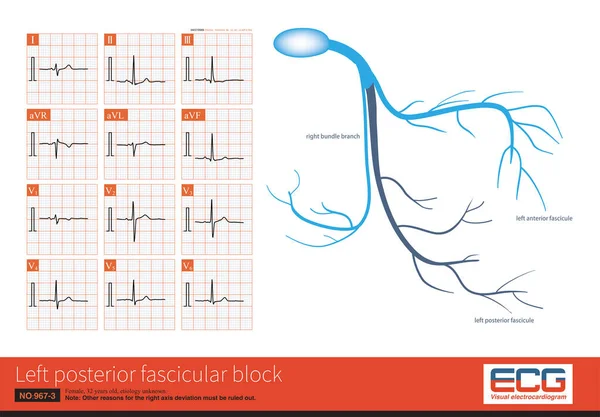
Stock image Male, 39 years old, paroxysmal palpitations for 5 years. ECG showed B type ventricular preexcitation.The bypass may be located in the right posterior free wall.
Published:
Apr.24, 2024 19:49:31
Author:
asia11m
Views:
3
Downloads:
0
File type:
image
/
jpg
File size:
13.2 MB
Orginal size:
10000
x
6424
px
Available sizes:
S
(500 x 321)
M
(1000 x 642)
L
(2000 x 1285)
XL
(10000 x 6424)
EL0
(10000 x 6424)
Level:
beginner
Download Image
Image topics:
Illustration
Human
Health
Medicine
Medical
Cardiology
Heart
Pulse
Disease
Education
Science
Death
Muscle
Graph
Diagnosis
Heartbeat
Anatomy
Bypass
Cardiogram
Cardiac
Ekg
Electrocardiogram
Ecg
Arrhythmia
Myocardium
Tachyarrhythmia
Left Ventricle
Right Ventricle
Circular Motion
Left Atrium
Right Atrium
Limb Leads
Conduction System
Cardiac Anatomy
Atrioventricular Reentrant Tachycardia
Atrioventricular Node
Sinus Tachycardia
St Segment
Ecg Education
Qrs Wave
Accessory Pathway
Wide Qrs Tachycardia
Ventricular Preexcitation
St T Change
Right Accessory Pathway
Purkinje Fiber
Left Accessory Pathway
His Bundle
Similar stock images
Male, 48 Years Old, Paroxysmal Palpitations For 10 Years. ECG Suggests Ventricular Preexcitation, And The Bypass Tract May Be Located In The Left Posterior Septum.
10000 × 5781
Male, 36 Years Old, Without Any Clinical Symptoms. Type B Preexcitation Was Found In ECG, And The Deduced Accessory Pathway Was Located In The Right Heart And Posterior Free Wall.
10000 × 5878
Female, 34 Years Old, With A History Of Paroxysmal Palpitation For 6 Years. ECG Indicates Type B Preexcitation. The Patient Received Successful Radiofrequency Ablation.The Accessory Pathway Was Located In The Later Lateral Wall Of The RV.
10000 × 5587
During Left Posterior Fascicular Block, The ECG Showed Right Axis Deviation. The QRS Wave In Leads I And AVL Was RS Wave, And The Duration Of QRS Wave Was Less Than 120 Ms.
10000 × 6963
When The Electrical Axis Of The Electrocardiogram Is Severely Left Deviation, Especially Near The Negative Side Of The AVF Lead Axis, Significant S-waves Appear In Leads I, II, And III.
10000 × 6242
When The Frontal QRS Axis Is Located At -8, The Maximum Ventricular Depolarization Potential Is Oriented Towards Lead I, And The R Wave Amplitude Of Lead I Is The Highest.
10000 × 5871
When The Frontal QRS Axis Is Located At -8, The Maximum Ventricular Depolarization Potential Is Oriented Towards Lead I, And The R Wave Amplitude Of Lead I Is The Highest.
10000 × 5871
When The Frontal Axis Is +43 , The Maximum QRS Depolarization Potential Is Closest To The Axis Of Lead So The R-wave Amplitude Of Lead Is The Highest.
10000 × 5583