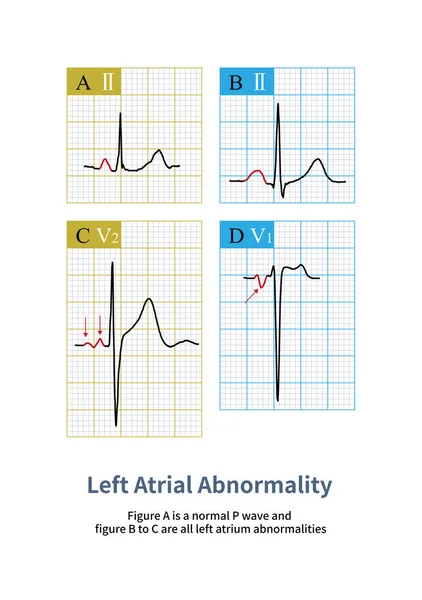
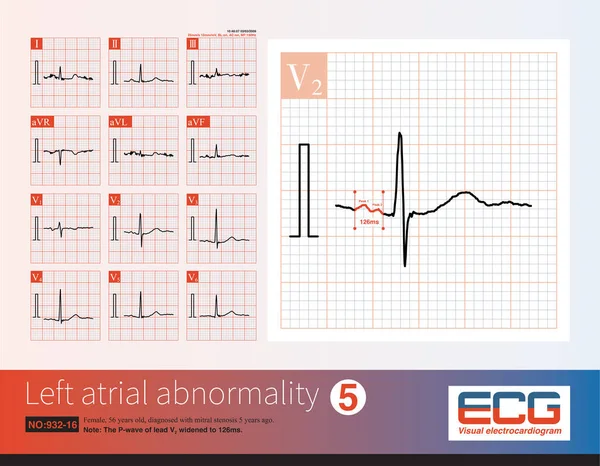
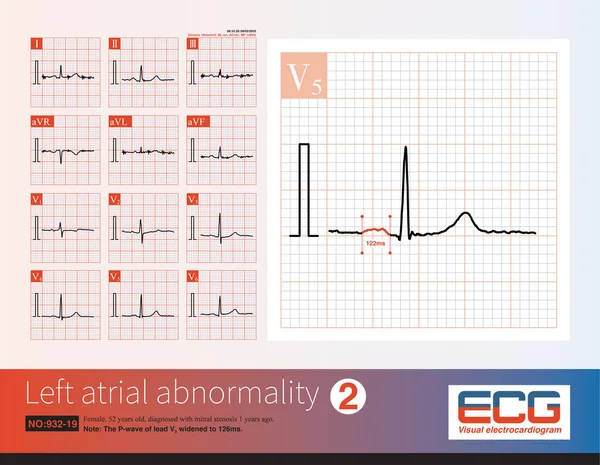
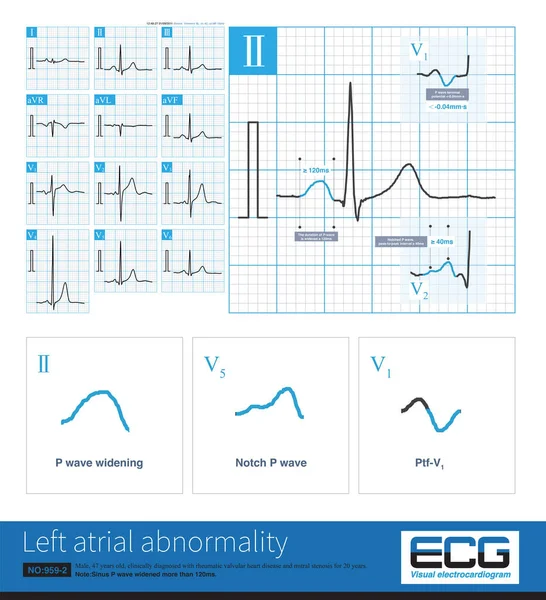
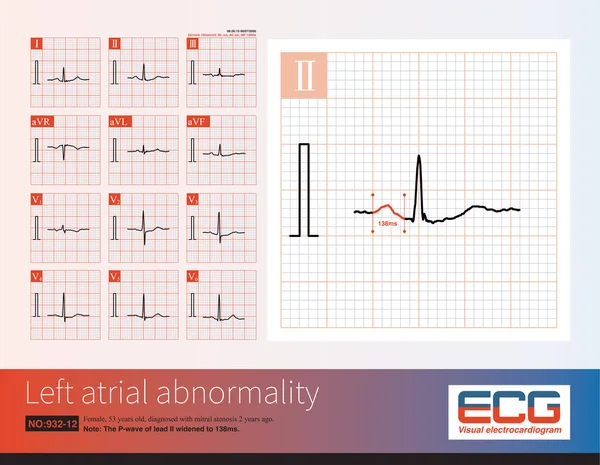
Stock image The ECG changes of left atrium abnormality include widening of P wave duration, bimodal P wave and increasing of P wave terminal potential in lead V1 lead P wave.

Published: Feb.29, 2024 13:38:07
Author: asia11m
Views: 1
Downloads: 0
File type: image / jpg
File size: 6.45 MB
Orginal size: 10000 x 6644 px
Available sizes:
Level: beginner