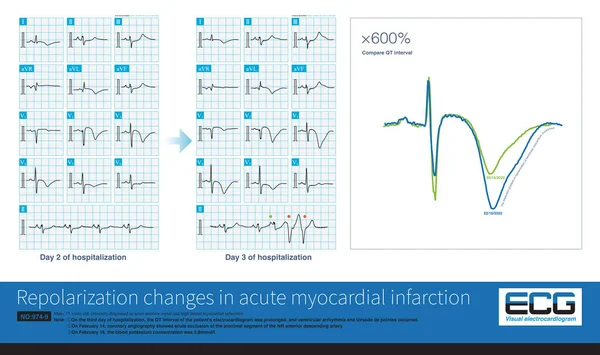
Stock image The effective refractory period of the ventricular muscle is equivalent to the time from the onset of QRS to the peak of the T wave on the ECG.

Published: May.30, 2024 10:20:55
Author: asia11m
Views: 0
Downloads: 0
File type: image / jpg
File size: 9.8 MB
Orginal size: 10000 x 10568 px
Available sizes:
Level: beginner