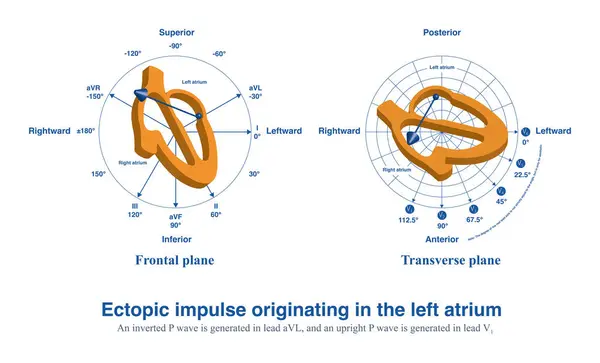
Stock image When ectopic impulses originate in the left atrium, an upright P wave will be generated in V1 and an inverted P wave in lead aVL.
Published: Apr.27, 2024 13:32:15
Author: asia11m
Views: 1
Downloads: 1
File type: image / jpg
File size: 7.38 MB
Orginal size: 10000 x 6060 px
Available sizes:
Level: beginner