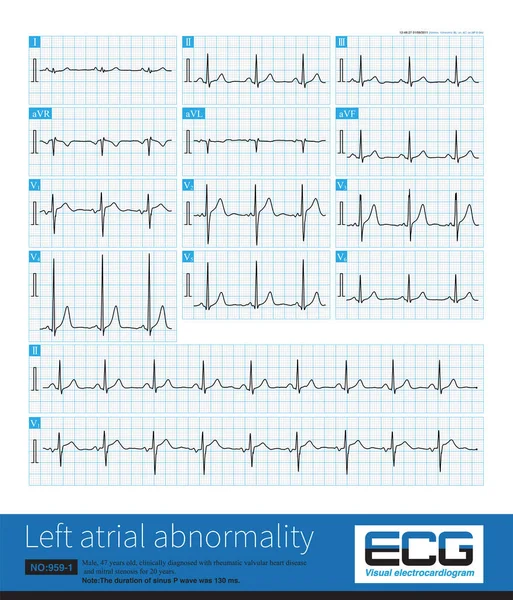
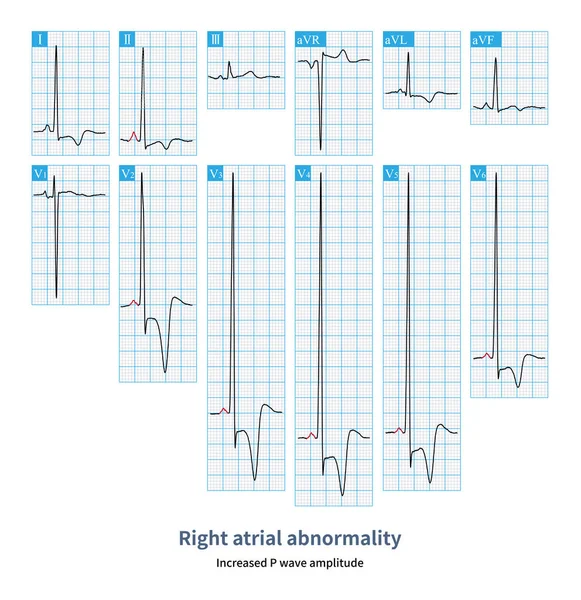
Stock image Female, 46 years old, clinically diagnosed with apical hypertrophic cardiomyopathy. Pay attention to the increased amplitude of sinus P waves in the electrocardiogram.
Published: May.02, 2023 11:13:28
Author: asia11m
Views: 0
Downloads: 0
File type: image / jpg
File size: 20.52 MB
Orginal size: 10000 x 10319 px
Available sizes:
Level: beginner