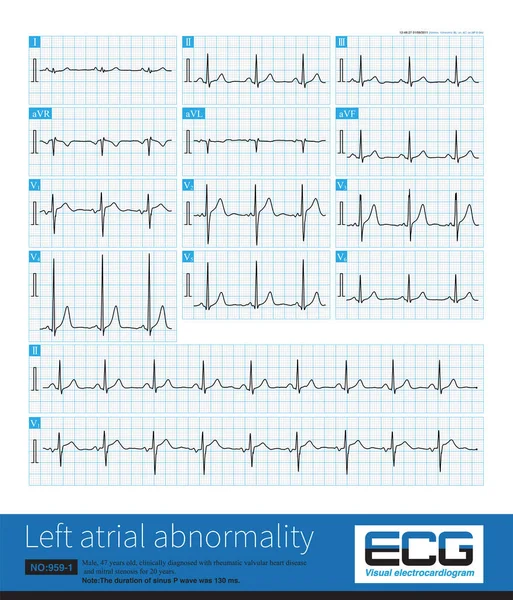
Stock image In clinic, mitral stenosis is a common organic heart disease that leads to left atrium abnormality in ECG. The duration of sinus P wave widens by more than 120ms.
Published: Nov.09, 2022 09:28:19
Author: asia11m
Views: 6
Downloads: 0
File type: image / jpg
File size: 31 MB
Orginal size: 10000 x 11694 px
Available sizes:
Level: beginner