photo free
Home Images Vectors Videos

Stock image When a short PR interval is found on the electrocardiogram, careful observation of the beginning of the QRS wave can reveal whether it is ventricular preexcitation.

Stock image When a short PR interval is found on the electrocardiogram, careful observation of the beginning of the QRS wave can reveal whether it is ventricular preexcitation.
Published: Jun.29, 2024 10:13:25
Author: asia11m
Views: 0
Downloads: 0
File type: image / jpg
File size: 8.71 MB
Orginal size: 10000 x 7702 px
Available sizes:
S
(500 x 385)
M
(1000 x 770)
L
(2000 x 1540)
XL
(10000 x 7702)
EL0
(10000 x 7702)
Level: beginner
Download Image
Image topics:

Similar stock images

stock image The PR interval of an adult ECG is less than 120 ms, which is called a short PR interval.

The PR Interval Of An Adult ECG Is Less Than 120 Ms, Which Is Called A Short PR Interval.

10000 × 6789
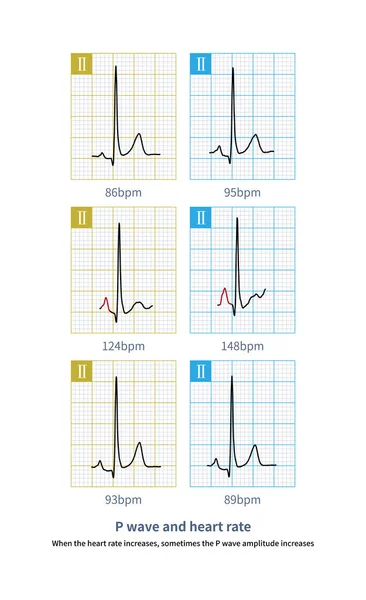
stock image When the heart rate increases, sometimes the P wave amplitude increases.This is a physiological phenomenon, do not diagnose the right atrial abnormality.

When The Heart Rate Increases, Sometimes The P Wave Amplitude Increases.This Is A Physiological Phenomenon, Do Not Diagnose The Right Atrial Abnormality.

8000 × 13087
stock image The standard for diagnosing right atrial abnormality in ECG is that the amplitude of P-wave in limb leadsI is greater than 2.5mm, and the amplitude of upright P-wave in chest leads is  1.5mm.

The Standard For Diagnosing Right Atrial Abnormality In ECG Is That The Amplitude Of P-wave In Limb LeadsI Is Greater Than 2.5mm, And The Amplitude Of Upright P-wave In Chest Leads Is 1.5mm.

10000 × 11279
stock image Male, 13 years old, clinically diagnosed with secundum atrial septal defect. Note that the QRS wave in lead V1 of the electrocardiogram has a qR shape, indicating right ventricular hypertrophy.

Male, 13 Years Old, Clinically Diagnosed With Secundum Atrial Septal Defect. Note That The QRS Wave In Lead V1 Of The Electrocardiogram Has A QR Shape, Indicating Right Ventricular Hypertrophy.

10000 × 7203
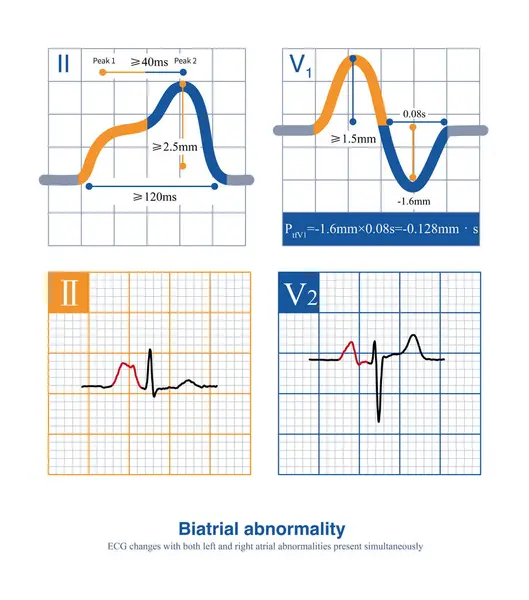
stock image When the duration of the P wave exceeds 120 ms, the amplitude of the limb leads exceeds 2.5 mm, and the amplitude of the thoracic leads exceeds 1.5 mm, it is interpreted as a biatrial abnormality.

When The Duration Of The P Wave Exceeds 120 Ms, The Amplitude Of The Limb Leads Exceeds 2.5 Mm, And The Amplitude Of The Thoracic Leads Exceeds 1.5 Mm, It Is Interpreted As A Biatrial Abnormality.

10000 × 11335
stock image Normal sinus P waves, which may appear as upright, inverted, or biphasic in different leads, depend on the direction of atrial exaltation and the lead axis.

Normal Sinus P Waves, Which May Appear As Upright, Inverted, Or Biphasic In Different Leads, Depend On The Direction Of Atrial Exaltation And The Lead Axis.

10000 × 12317
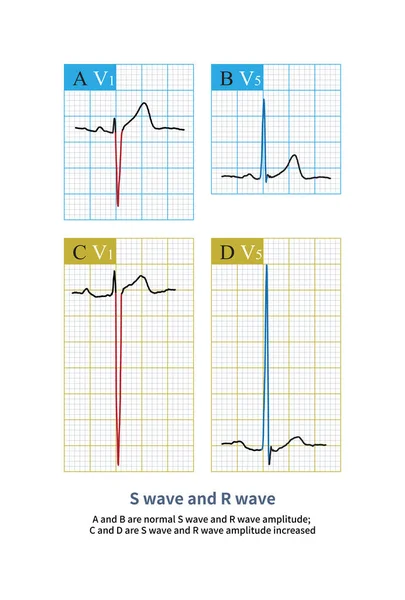
stock image A and B are the normal S wave and R wave amplitude; C and D are the S wave and R wave of a case of left ventricular hypertrophy with a significant increase in amplitude.

A And B Are The Normal S Wave And R Wave Amplitude; C And D Are The S Wave And R Wave Of A Case Of Left Ventricular Hypertrophy With A Significant Increase In Amplitude.

10000 × 14790
stock image Male, 34 years old, clinically diagnosed with polycythemia vera. The electrocardiogram indicates atrial abnormality and right ventricular hypertrophy.

Male, 34 Years Old, Clinically Diagnosed With Polycythemia Vera. The Electrocardiogram Indicates Atrial Abnormality And Right Ventricular Hypertrophy.

10000 × 6570