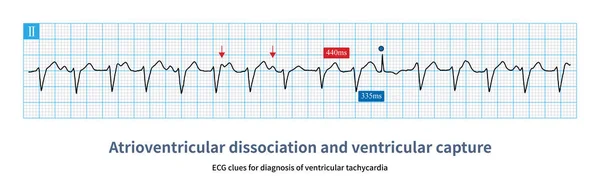
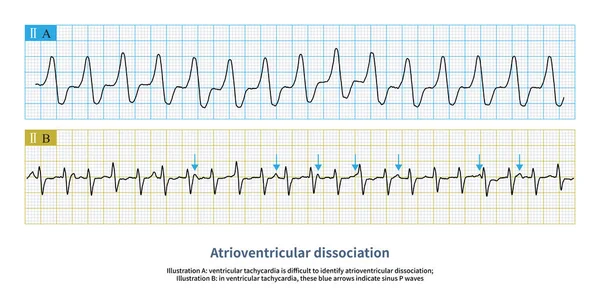
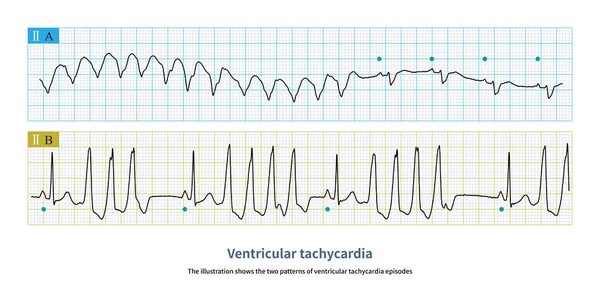
Stock image Atrioventricular separation is a clue to the diagnosis of ventricular tachycardia. The grass yellow arrow shows the sinus P wave, which is obviously not related to the QRS wave.

Published: Mar.23, 2023 08:52:31
Author: asia11m
Views: 2
Downloads: 0
File type: image / jpg
File size: 6.27 MB
Orginal size: 10000 x 3338 px
Available sizes:
Level: beginner